
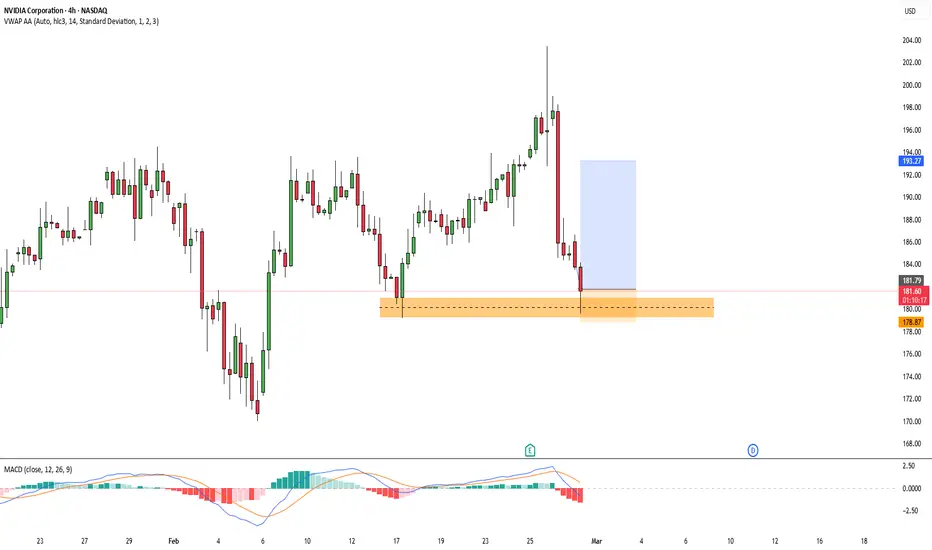
Based on the chart of NVIDIA (NVDA) from February 27, 2026, here is a technical breakdown of why this setup presents a high-probability long opportunity.
🚀 NVDA Trade Setup: Bullish Reversal at Key Demand
NVIDIA is currently showing a classic "Buy the Dip" confirmation on the 4-hour timeframe. We are looking at a potential trend continuation as the price enters a high-interest liquidity zone.
1. Demand Zone Validation
The price has retraced into a significant Demand Zone (highlighted in orange) between $179 - $182. This area previously acted as a strong base for the last major move up, and the current price action shows signs of "absorption" where buyers are stepping back in.
2. Optimal Fibonacci Retracement
Using the Fibonacci tool to measure the previous impulse move:
The 70.5% Level: The price has dipped below the 50% equilibrium and tapped the 70.5% OTE (Optimal Trade Entry) level.
Deep Discount: Buying at the 61.8% to 70.5% range provides a "discounted" entry price, allowing for a much tighter stop-loss and a higher reward potential.
3. Momentum Shift (MACD/Squeeze)
Looking at the momentum oscillator at the bottom of the chart:
The bearish momentum (red bars) is beginning to fade and curl upward.
We are anticipating a "Squeeze" release, where the volatility shifts from selling pressure to a rapid buy-side expansion.
4. Risk-to-Reward (R:R) Profile
This trade offers an asymmetric risk profile, which is the hallmark of professional trading:
Entry: $181.50 - $182.00.
Stop Loss: Just below the demand zone at $178.50 (protecting against a structural break).
Target 1: $193.27 (Recent Highs).
Target 2: $200.00+ (Psychological Resistance).
Summary: The combination of a retest of a major demand zone, a deep Fibonacci retracement, and exhausting selling momentum makes this a prime candidate for a long position.
🚀 NVDA Trade Setup: Bullish Reversal at Key Demand
NVIDIA is currently showing a classic "Buy the Dip" confirmation on the 4-hour timeframe. We are looking at a potential trend continuation as the price enters a high-interest liquidity zone.
1. Demand Zone Validation
The price has retraced into a significant Demand Zone (highlighted in orange) between $179 - $182. This area previously acted as a strong base for the last major move up, and the current price action shows signs of "absorption" where buyers are stepping back in.
2. Optimal Fibonacci Retracement
Using the Fibonacci tool to measure the previous impulse move:
The 70.5% Level: The price has dipped below the 50% equilibrium and tapped the 70.5% OTE (Optimal Trade Entry) level.
Deep Discount: Buying at the 61.8% to 70.5% range provides a "discounted" entry price, allowing for a much tighter stop-loss and a higher reward potential.
3. Momentum Shift (MACD/Squeeze)
Looking at the momentum oscillator at the bottom of the chart:
The bearish momentum (red bars) is beginning to fade and curl upward.
We are anticipating a "Squeeze" release, where the volatility shifts from selling pressure to a rapid buy-side expansion.
4. Risk-to-Reward (R:R) Profile
This trade offers an asymmetric risk profile, which is the hallmark of professional trading:
Entry: $181.50 - $182.00.
Stop Loss: Just below the demand zone at $178.50 (protecting against a structural break).
Target 1: $193.27 (Recent Highs).
Target 2: $200.00+ (Psychological Resistance).
Summary: The combination of a retest of a major demand zone, a deep Fibonacci retracement, and exhausting selling momentum makes this a prime candidate for a long position.

면책사항
해당 정보와 게시물은 금융, 투자, 트레이딩 또는 기타 유형의 조언이나 권장 사항으로 간주되지 않으며, 트레이딩뷰에서 제공하거나 보증하는 것이 아닙니다. 자세한 내용은 이용 약관을 참조하세요.
면책사항
해당 정보와 게시물은 금융, 투자, 트레이딩 또는 기타 유형의 조언이나 권장 사항으로 간주되지 않으며, 트레이딩뷰에서 제공하거나 보증하는 것이 아닙니다. 자세한 내용은 이용 약관을 참조하세요.