
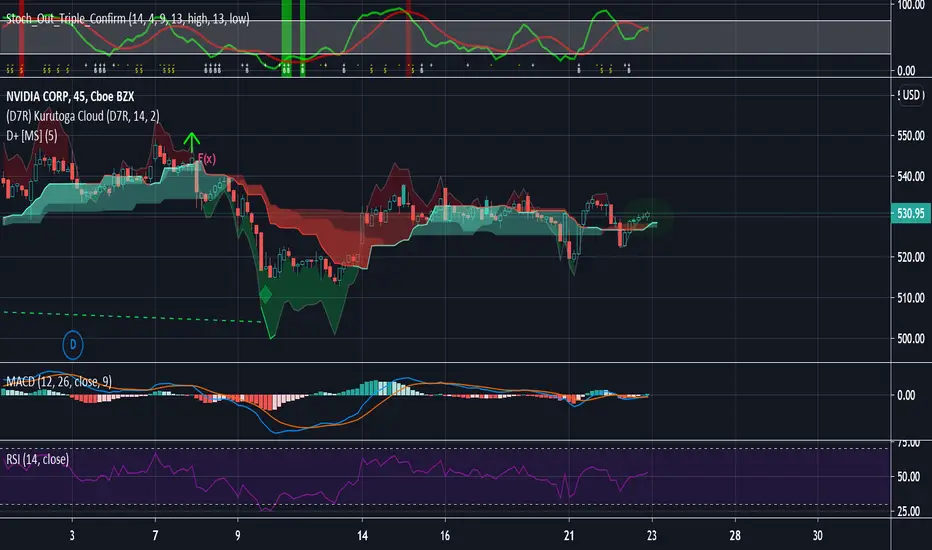
Welcome to the continuation of analyzing NVDA, many of you may be familiar with this feature I will be explaining but read anyways as it will be short and sweet.
cont.
Step 3. Once you have a candlestick chart you feel comfortable reading and see a trend, use signals and indicators to back you up. With the F(x) feature you can add any indicator you want and in this tutorial I will be showing the main ones I use.
Step 4. When you click on the F(x) it gives you the option to search for indicators, the indicators I use on all my charts are
Once all these are in place you can start analyzing, and I will discuss what to look at for each one listed in the next tutorial
cont.
Step 3. Once you have a candlestick chart you feel comfortable reading and see a trend, use signals and indicators to back you up. With the F(x) feature you can add any indicator you want and in this tutorial I will be showing the main ones I use.
Step 4. When you click on the F(x) it gives you the option to search for indicators, the indicators I use on all my charts are
- Divergence+ by Market Scriptors (the only one in this tutorial that cost a monthly subscription because it is so accurate)
- Guth_3x_Confirm by Cguthrie 922
- Kurotoga Cloud by D7R
- MACD by Tradingview
- Relative stregnth Index by Tradingview
Once all these are in place you can start analyzing, and I will discuss what to look at for each one listed in the next tutorial

관련 발행물
면책사항
해당 정보와 게시물은 금융, 투자, 트레이딩 또는 기타 유형의 조언이나 권장 사항으로 간주되지 않으며, 트레이딩뷰에서 제공하거나 보증하는 것이 아닙니다. 자세한 내용은 이용 약관을 참조하세요.
면책사항
해당 정보와 게시물은 금융, 투자, 트레이딩 또는 기타 유형의 조언이나 권장 사항으로 간주되지 않으며, 트레이딩뷰에서 제공하거나 보증하는 것이 아닙니다. 자세한 내용은 이용 약관을 참조하세요.