

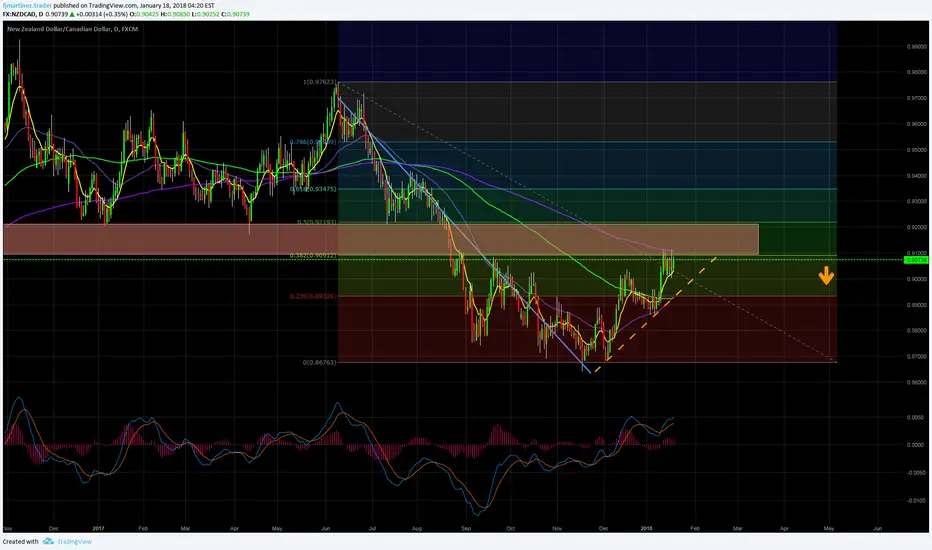
With the NZDCAD we have the reverse situation as I writed in the EURAUD analysis , it is in an downward rally, is inside correction and is finding an historic support area coinciding with fibonacci level of 38% and is touching the 300 WMA. It could be a signal showing the end of the correction.
I draw a trend line (Orange line) and if it is crossed downward and the 150 WMA (Green) is crossed too, I'll open a sell order with:
- Partial close 0.8710
- Stop loss 0.9260.
- Last partial close, moving the stop loss.
Remember:
You Never should convert a Winning position into a lossing position
I draw a trend line (Orange line) and if it is crossed downward and the 150 WMA (Green) is crossed too, I'll open a sell order with:
- Partial close 0.8710
- Stop loss 0.9260.
- Last partial close, moving the stop loss.
Remember:
You Never should convert a Winning position into a lossing position

면책사항
해당 정보와 게시물은 금융, 투자, 트레이딩 또는 기타 유형의 조언이나 권장 사항으로 간주되지 않으며, 트레이딩뷰에서 제공하거나 보증하는 것이 아닙니다. 자세한 내용은 이용 약관을 참조하세요.
면책사항
해당 정보와 게시물은 금융, 투자, 트레이딩 또는 기타 유형의 조언이나 권장 사항으로 간주되지 않으며, 트레이딩뷰에서 제공하거나 보증하는 것이 아닙니다. 자세한 내용은 이용 약관을 참조하세요.