

Hey guys,
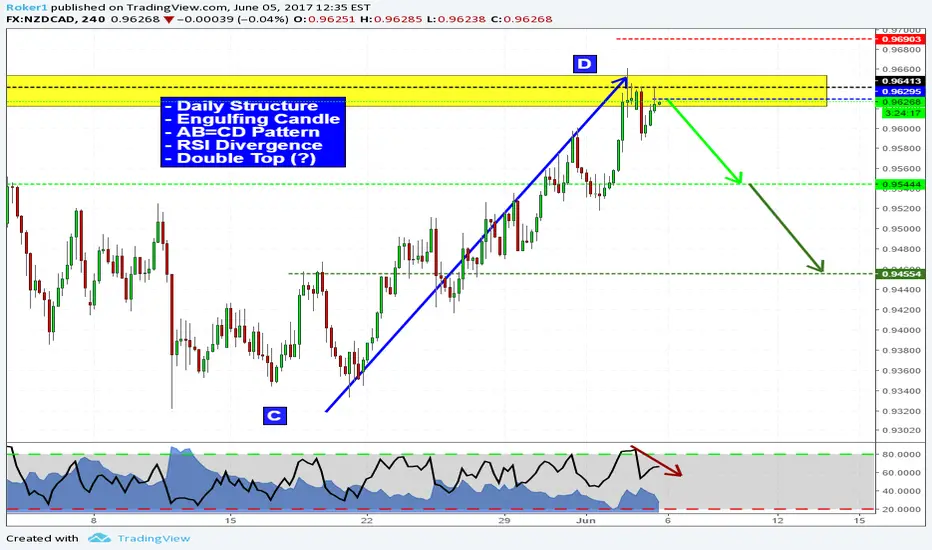
this is the 4hr chart on NZDCAD but my analysis, as usual, starts from higher timeframes: on the daily price has just touched a key level of structure (yellow box) along with the D point of an AB=CD pattern. As we go on lower timeframes such as 4hr you can see price has formed a pinbar followed by an engulfing red candle in overbought condition. Then at the retest of the highs we see RSI divergence and less strength in price action.
These are all good signs for a reversal. Let's see how it plays out.
Stops above highs, targets as displayed above.
If you have any question or if you want to share your view, feel free to comment below.
Otherwise, see you in the next chart!
this is the 4hr chart on NZDCAD but my analysis, as usual, starts from higher timeframes: on the daily price has just touched a key level of structure (yellow box) along with the D point of an AB=CD pattern. As we go on lower timeframes such as 4hr you can see price has formed a pinbar followed by an engulfing red candle in overbought condition. Then at the retest of the highs we see RSI divergence and less strength in price action.
These are all good signs for a reversal. Let's see how it plays out.
Stops above highs, targets as displayed above.
If you have any question or if you want to share your view, feel free to comment below.
Otherwise, see you in the next chart!
거래청산: 스탑 닿음

면책사항
해당 정보와 게시물은 금융, 투자, 트레이딩 또는 기타 유형의 조언이나 권장 사항으로 간주되지 않으며, 트레이딩뷰에서 제공하거나 보증하는 것이 아닙니다. 자세한 내용은 이용 약관을 참조하세요.
면책사항
해당 정보와 게시물은 금융, 투자, 트레이딩 또는 기타 유형의 조언이나 권장 사항으로 간주되지 않으며, 트레이딩뷰에서 제공하거나 보증하는 것이 아닙니다. 자세한 내용은 이용 약관을 참조하세요.