

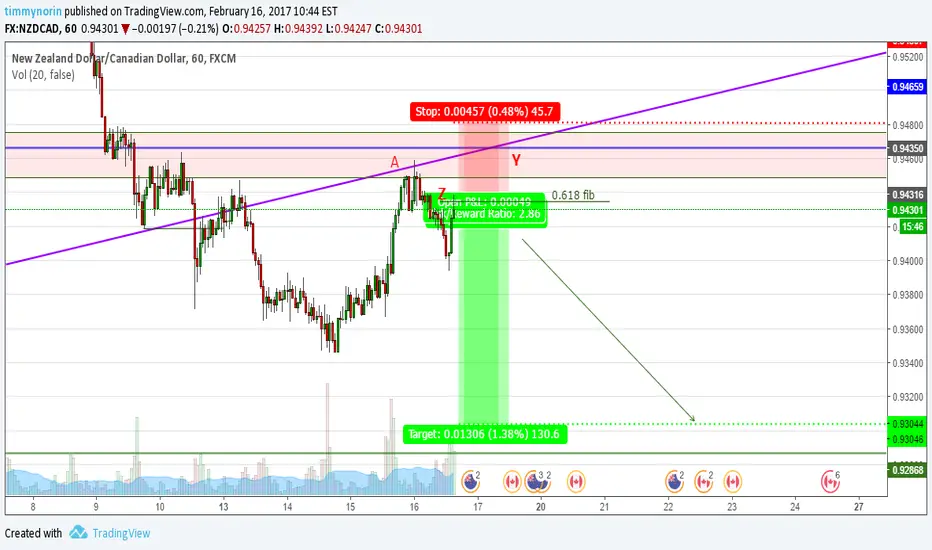
A few clues here adding to this case:
Price clearly respected;
0.382 fib
Trend line
Structure
And it showed it respect by showing a double top (A) followed by a 2618 (X).
To our protection we have structure zone + fib + trend line (Z), all combining.
I entered my first position after double top.
Second position after 2618
Its a bold target, but price gives clear signals of its path.
My 1 enemy here is the bullish engulfing candle on the daily. But.. IF we want to find reasons NOT to enter, we will alwasy find it. We just have to weigh the odds against eachother.
As my last post, Im not even worried about the monetary loss, its already gone in my mind (lifts the stress off ones shoulders). I'm more interested in following this!
(NZDCAD have previously given clear signals, and then doing the exact opposite, will it continue?)
Price clearly respected;
0.382 fib
Trend line
Structure
And it showed it respect by showing a double top (A) followed by a 2618 (X).
To our protection we have structure zone + fib + trend line (Z), all combining.
I entered my first position after double top.
Second position after 2618
Its a bold target, but price gives clear signals of its path.
My 1 enemy here is the bullish engulfing candle on the daily. But.. IF we want to find reasons NOT to enter, we will alwasy find it. We just have to weigh the odds against eachother.
As my last post, Im not even worried about the monetary loss, its already gone in my mind (lifts the stress off ones shoulders). I'm more interested in following this!
(NZDCAD have previously given clear signals, and then doing the exact opposite, will it continue?)

면책사항
해당 정보와 게시물은 금융, 투자, 트레이딩 또는 기타 유형의 조언이나 권장 사항으로 간주되지 않으며, 트레이딩뷰에서 제공하거나 보증하는 것이 아닙니다. 자세한 내용은 이용 약관을 참조하세요.
면책사항
해당 정보와 게시물은 금융, 투자, 트레이딩 또는 기타 유형의 조언이나 권장 사항으로 간주되지 않으며, 트레이딩뷰에서 제공하거나 보증하는 것이 아닙니다. 자세한 내용은 이용 약관을 참조하세요.