

1️⃣ Higher-Timeframe Context
Market has been in a descending channel since mid-year
Momentum to the downside is weakening
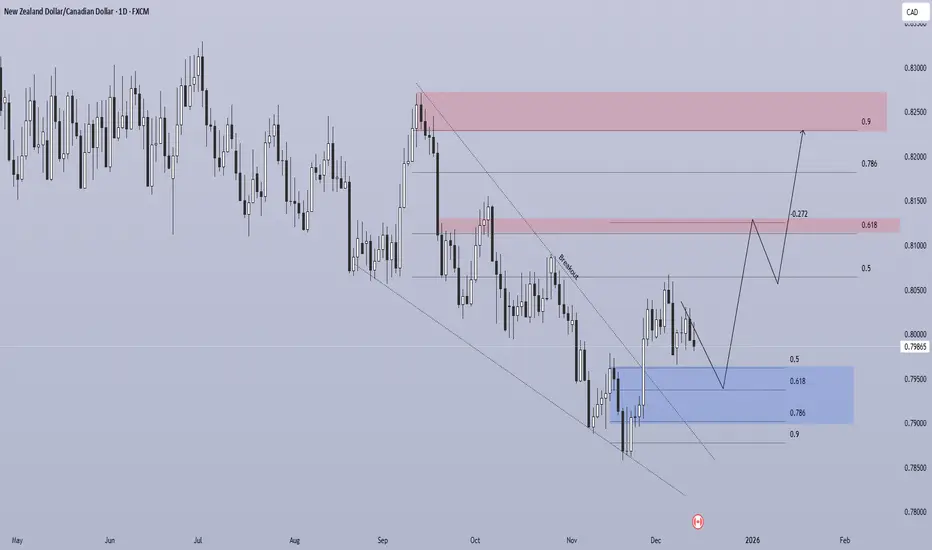
Price has broken the descending trendline, signaling early trend shift
This suggests we are in an early reversal / accumulation phase, not yet a confirmed uptrend.
2️⃣ Market Structure & Price Action
🔹 Trendline Breakout
Clear breakout above the descending trendline
Price is now retesting the breakout zone, which is constructive
🔹 Demand / Accumulation Zone (Blue)
Approx. 0.7900 – 0.7950
Confluence of:
Fibonacci 0.618 – 0.786
Prior structure support
Liquidity absorption
This zone acts as a Last Point of Support (LPS).
3️⃣ Fibonacci & Liquidity Framework
🔵 Below Price
0.9 retracement has been fully swept
Limited sell-side liquidity remains below current price
🔴 Above Price (Liquidity Targets)
0.8050 → 0.5 retracement (intermediate resistance)
0.8120 – 0.8150 → 0.618 + -0.272 extension (key reaction zone)
0.8200 → 0.786 retracement
0.8250 → 0.9 retracement (major liquidity pool)
Liquidity is clearly stacked above price, favoring upside continuation.
4️⃣ Expected Price Path (Primary Scenario)
Price holds above 0.7900
Forms a higher low inside the blue demand zone
Pushes toward 0.8050
Shallow pullback (bullish continuation)
Expansion toward:
0.8120 – 0.8150
0.8200
0.8250 (main target)
This aligns with a Wyckoff accumulation → Phase D markup.
Market has been in a descending channel since mid-year
Momentum to the downside is weakening
Price has broken the descending trendline, signaling early trend shift
This suggests we are in an early reversal / accumulation phase, not yet a confirmed uptrend.
2️⃣ Market Structure & Price Action
🔹 Trendline Breakout
Clear breakout above the descending trendline
Price is now retesting the breakout zone, which is constructive
🔹 Demand / Accumulation Zone (Blue)
Approx. 0.7900 – 0.7950
Confluence of:
Fibonacci 0.618 – 0.786
Prior structure support
Liquidity absorption
This zone acts as a Last Point of Support (LPS).
3️⃣ Fibonacci & Liquidity Framework
🔵 Below Price
0.9 retracement has been fully swept
Limited sell-side liquidity remains below current price
🔴 Above Price (Liquidity Targets)
0.8050 → 0.5 retracement (intermediate resistance)
0.8120 – 0.8150 → 0.618 + -0.272 extension (key reaction zone)
0.8200 → 0.786 retracement
0.8250 → 0.9 retracement (major liquidity pool)
Liquidity is clearly stacked above price, favoring upside continuation.
4️⃣ Expected Price Path (Primary Scenario)
Price holds above 0.7900
Forms a higher low inside the blue demand zone
Pushes toward 0.8050
Shallow pullback (bullish continuation)
Expansion toward:
0.8120 – 0.8150
0.8200
0.8250 (main target)
This aligns with a Wyckoff accumulation → Phase D markup.

✅FREE FOREX &CRYPTO SIGNALS TELEGRAM CHANNEL:
t.me/winlouhscalperchannel
t.me/winlouhscalperchannel
면책사항
해당 정보와 게시물은 금융, 투자, 트레이딩 또는 기타 유형의 조언이나 권장 사항으로 간주되지 않으며, 트레이딩뷰에서 제공하거나 보증하는 것이 아닙니다. 자세한 내용은 이용 약관을 참조하세요.
✅FREE FOREX &CRYPTO SIGNALS TELEGRAM CHANNEL:
t.me/winlouhscalperchannel
t.me/winlouhscalperchannel
면책사항
해당 정보와 게시물은 금융, 투자, 트레이딩 또는 기타 유형의 조언이나 권장 사항으로 간주되지 않으며, 트레이딩뷰에서 제공하거나 보증하는 것이 아닙니다. 자세한 내용은 이용 약관을 참조하세요.