

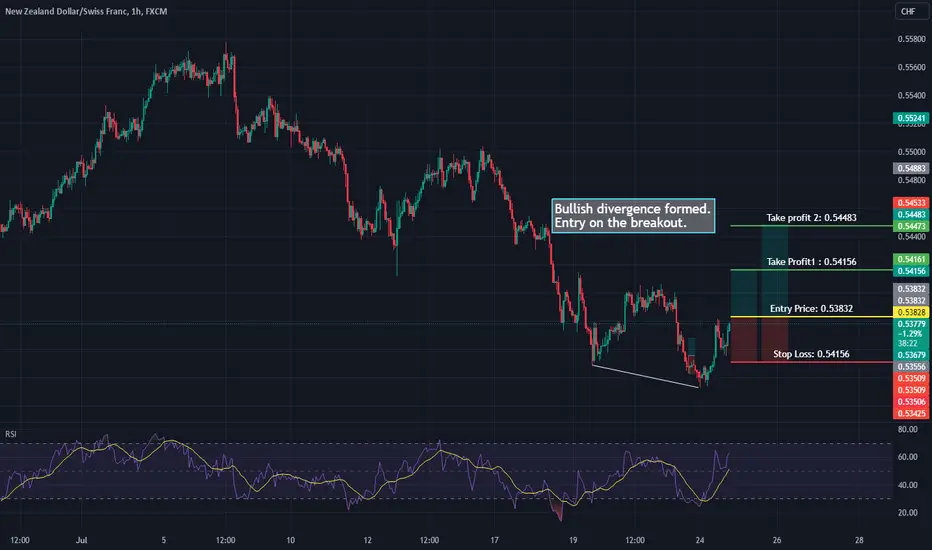
Bullish divergence formed.
Entry on the breakout.
The NZDCHF bullish long idea is based on two key technical indicators: breakout and bullish divergence.
Breakout: The NZDCHF currency pair has experienced a breakout above a significant resistance level. This breakout suggests a potential upward movement in the pair, indicating a shift in momentum in favor of the bulls. Traders often interpret breakouts as a signal for potential buying opportunities.
Bullish Divergence: In addition to the breakout, there is a presence of bullish divergence in the price action. This occurs when the price makes lower lows, but the corresponding indicator (such as RSI or MACD) makes higher lows. It indicates that the selling pressure is weakening, and a bullish reversal might be on the horizon.
Combining these two technical signals, traders might consider taking a long position on the NZDCHF currency pair, anticipating further upward movement in the exchange rate. However, it is essential to perform further analysis and risk management before executing any trades. Traders should also be aware of potential risks, such as unforeseen market events or changes in economic fundamentals that could impact the currency pair's direction. As with any trading idea, it is crucial to consider your own trading strategy and risk tolerance before making any decisions.
Entry on the breakout.
The NZDCHF bullish long idea is based on two key technical indicators: breakout and bullish divergence.
Breakout: The NZDCHF currency pair has experienced a breakout above a significant resistance level. This breakout suggests a potential upward movement in the pair, indicating a shift in momentum in favor of the bulls. Traders often interpret breakouts as a signal for potential buying opportunities.
Bullish Divergence: In addition to the breakout, there is a presence of bullish divergence in the price action. This occurs when the price makes lower lows, but the corresponding indicator (such as RSI or MACD) makes higher lows. It indicates that the selling pressure is weakening, and a bullish reversal might be on the horizon.
Combining these two technical signals, traders might consider taking a long position on the NZDCHF currency pair, anticipating further upward movement in the exchange rate. However, it is essential to perform further analysis and risk management before executing any trades. Traders should also be aware of potential risks, such as unforeseen market events or changes in economic fundamentals that could impact the currency pair's direction. As with any trading idea, it is crucial to consider your own trading strategy and risk tolerance before making any decisions.

면책사항
해당 정보와 게시물은 금융, 투자, 트레이딩 또는 기타 유형의 조언이나 권장 사항으로 간주되지 않으며, 트레이딩뷰에서 제공하거나 보증하는 것이 아닙니다. 자세한 내용은 이용 약관을 참조하세요.
면책사항
해당 정보와 게시물은 금융, 투자, 트레이딩 또는 기타 유형의 조언이나 권장 사항으로 간주되지 않으며, 트레이딩뷰에서 제공하거나 보증하는 것이 아닙니다. 자세한 내용은 이용 약관을 참조하세요.