

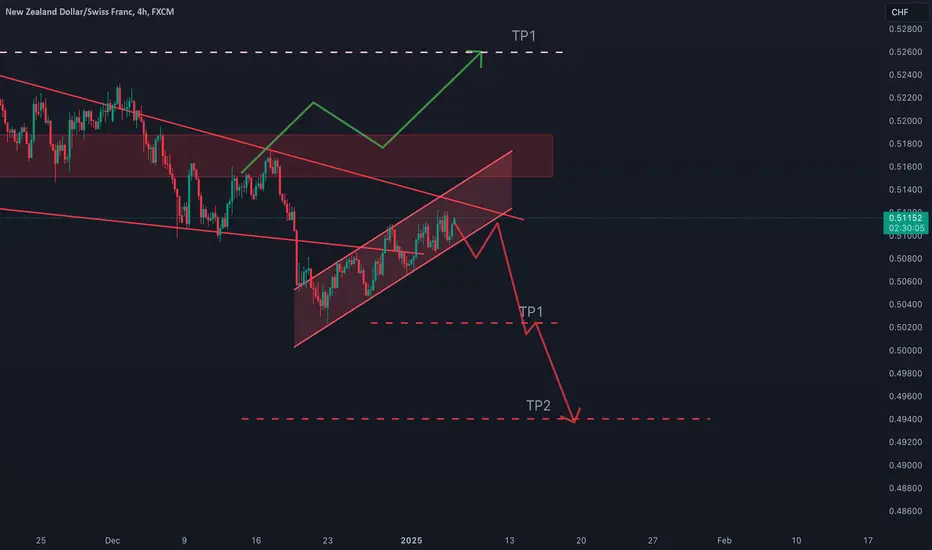
I had previously shared a chart for nzdchf. I was expecting the wedge to rise to 0.5250 if it tested the support zone after the upward breakout, but the price broke the wedge downwards instead of upward. Now it is inside the wedge again and has formed an inverted flag formation. With the downward breakout of the channel, the TP zones will be as in the chart.

면책사항
해당 정보와 게시물은 금융, 투자, 트레이딩 또는 기타 유형의 조언이나 권장 사항으로 간주되지 않으며, 트레이딩뷰에서 제공하거나 보증하는 것이 아닙니다. 자세한 내용은 이용 약관을 참조하세요.
면책사항
해당 정보와 게시물은 금융, 투자, 트레이딩 또는 기타 유형의 조언이나 권장 사항으로 간주되지 않으며, 트레이딩뷰에서 제공하거나 보증하는 것이 아닙니다. 자세한 내용은 이용 약관을 참조하세요.