

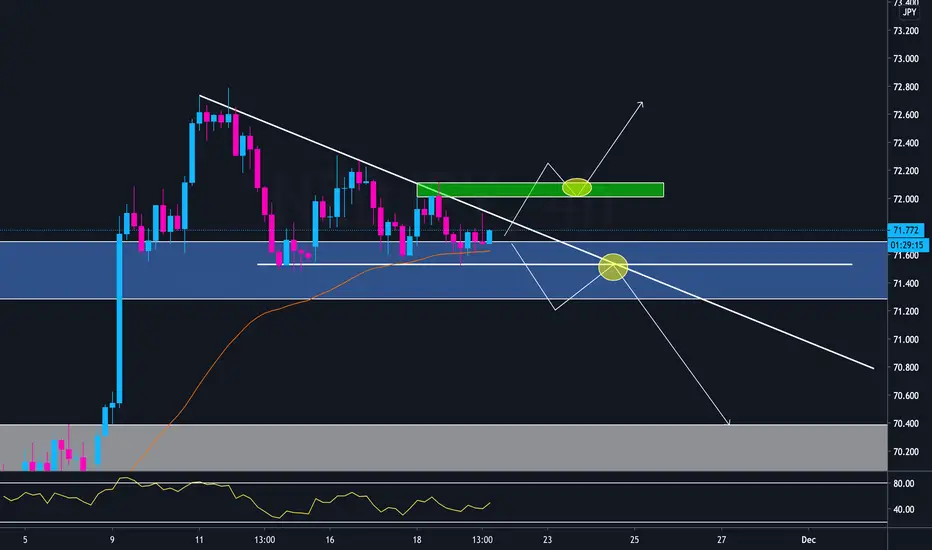
NZDJPY is showing a descending triangle formation at a key area of resistance. When we zoom out to the weekly, we can see the previous weekly candle showed a rejection of this zone and the current weekly candle is showing low bullish momentum. This pair has more potential to breakout to the downside rather than the upside but the market can do whatever it wants. For sells i'll be looking for a break of support and a retest, for buys i'll look for a break and retest of resistance.

면책사항
해당 정보와 게시물은 금융, 투자, 트레이딩 또는 기타 유형의 조언이나 권장 사항으로 간주되지 않으며, 트레이딩뷰에서 제공하거나 보증하는 것이 아닙니다. 자세한 내용은 이용 약관을 참조하세요.
면책사항
해당 정보와 게시물은 금융, 투자, 트레이딩 또는 기타 유형의 조언이나 권장 사항으로 간주되지 않으며, 트레이딩뷰에서 제공하거나 보증하는 것이 아닙니다. 자세한 내용은 이용 약관을 참조하세요.