

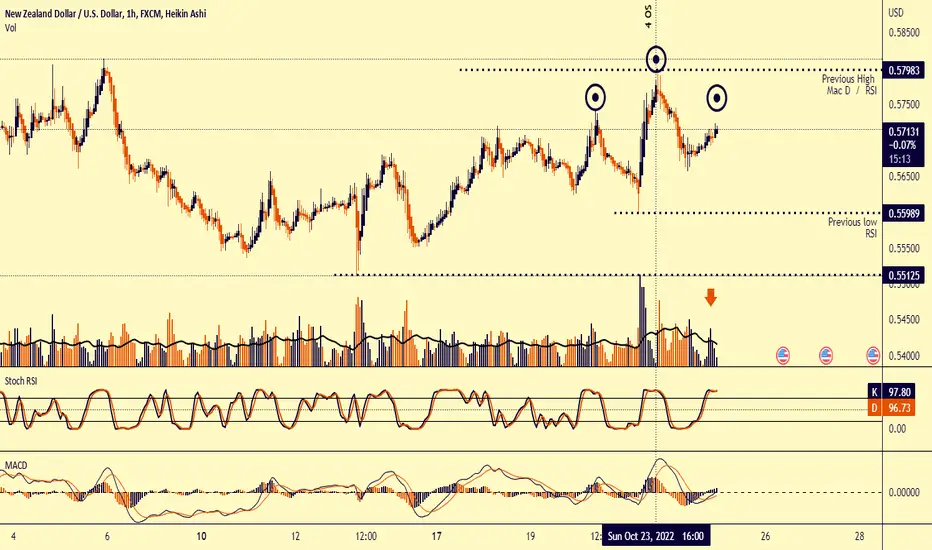
Update! Ok cool, looks like a Head and Shoulders pattern has been located where the circles are. The orange arrow shows price climbing on declining bull volume. Mac D is on top side. RSI is overbought and also could be creating a double top with a lower high which could be bearish divergence. Let's see if test the previous low RSI level. Price could continue to rise. However, it could exhaust down before a true move down.

면책사항
해당 정보와 게시물은 금융, 투자, 트레이딩 또는 기타 유형의 조언이나 권장 사항으로 간주되지 않으며, 트레이딩뷰에서 제공하거나 보증하는 것이 아닙니다. 자세한 내용은 이용 약관을 참조하세요.
면책사항
해당 정보와 게시물은 금융, 투자, 트레이딩 또는 기타 유형의 조언이나 권장 사항으로 간주되지 않으며, 트레이딩뷰에서 제공하거나 보증하는 것이 아닙니다. 자세한 내용은 이용 약관을 참조하세요.