

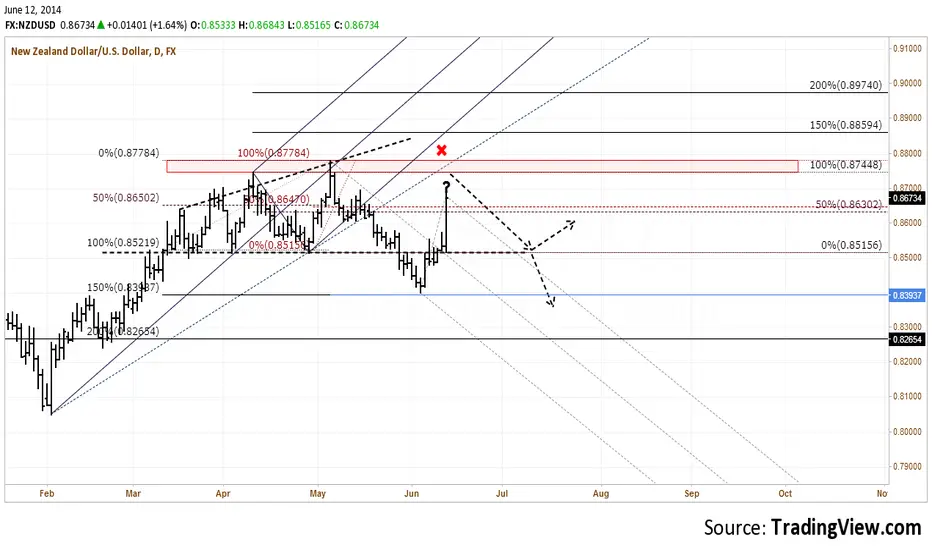
Current price action could be a fake move to the upside... Unless 0.8515 proves to be a tested support level.
Dashed light grey Median lines plots the potential down slope (but could be invalidated if price goes higher).
I expect the upside move to be capped not higher than 0.875 - 0.877. If price doesn't break this level, expect a test of support at 0.852, which if gives way could go all the way to 0.8265 to complete the broadening triangle's target.
Also look for the daily close. A pinbar kind of set up near 0.864 - 0.863 could give some clues.
Dashed light grey Median lines plots the potential down slope (but could be invalidated if price goes higher).
I expect the upside move to be capped not higher than 0.875 - 0.877. If price doesn't break this level, expect a test of support at 0.852, which if gives way could go all the way to 0.8265 to complete the broadening triangle's target.
Also look for the daily close. A pinbar kind of set up near 0.864 - 0.863 could give some clues.

관련 발행물
면책사항
해당 정보와 게시물은 금융, 투자, 트레이딩 또는 기타 유형의 조언이나 권장 사항으로 간주되지 않으며, 트레이딩뷰에서 제공하거나 보증하는 것이 아닙니다. 자세한 내용은 이용 약관을 참조하세요.
면책사항
해당 정보와 게시물은 금융, 투자, 트레이딩 또는 기타 유형의 조언이나 권장 사항으로 간주되지 않으며, 트레이딩뷰에서 제공하거나 보증하는 것이 아닙니다. 자세한 내용은 이용 약관을 참조하세요.