

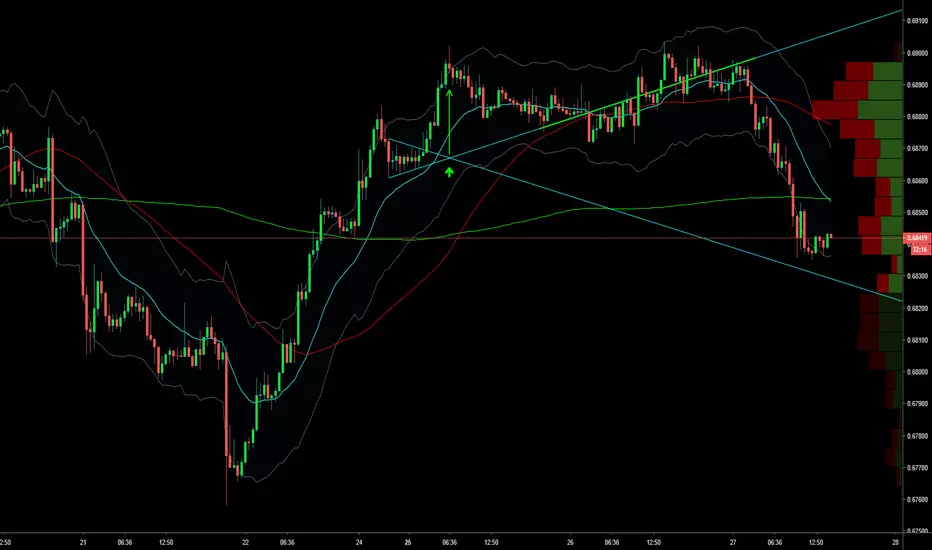
Just an informational chart chat on what I find interesting about the wedge pattern and its apex and continuing trend lines.
This week NZDUSD opened with a continued push higher followed by consolidation in a symmetrical wedge pattern and the again broke out in continuation to the upside.
What I find interesting is the action at the apex of the consolidation wedge and its extended trend lines.
The apex often signals the endpoint or exhaustion of the extended move as in this example.
Then, as we follow the wedge trendlines further, the price action in this example tends to balance itself along the rising trendline like a magnet first as support then as resistance.
This week NZDUSD opened with a continued push higher followed by consolidation in a symmetrical wedge pattern and the again broke out in continuation to the upside.
What I find interesting is the action at the apex of the consolidation wedge and its extended trend lines.
The apex often signals the endpoint or exhaustion of the extended move as in this example.
Then, as we follow the wedge trendlines further, the price action in this example tends to balance itself along the rising trendline like a magnet first as support then as resistance.
노트
and now the downside trendline from the wedge consolidation comes into play 
면책사항
해당 정보와 게시물은 금융, 투자, 트레이딩 또는 기타 유형의 조언이나 권장 사항으로 간주되지 않으며, 트레이딩뷰에서 제공하거나 보증하는 것이 아닙니다. 자세한 내용은 이용 약관을 참조하세요.
면책사항
해당 정보와 게시물은 금융, 투자, 트레이딩 또는 기타 유형의 조언이나 권장 사항으로 간주되지 않으며, 트레이딩뷰에서 제공하거나 보증하는 것이 아닙니다. 자세한 내용은 이용 약관을 참조하세요.