Ocean chart analysis
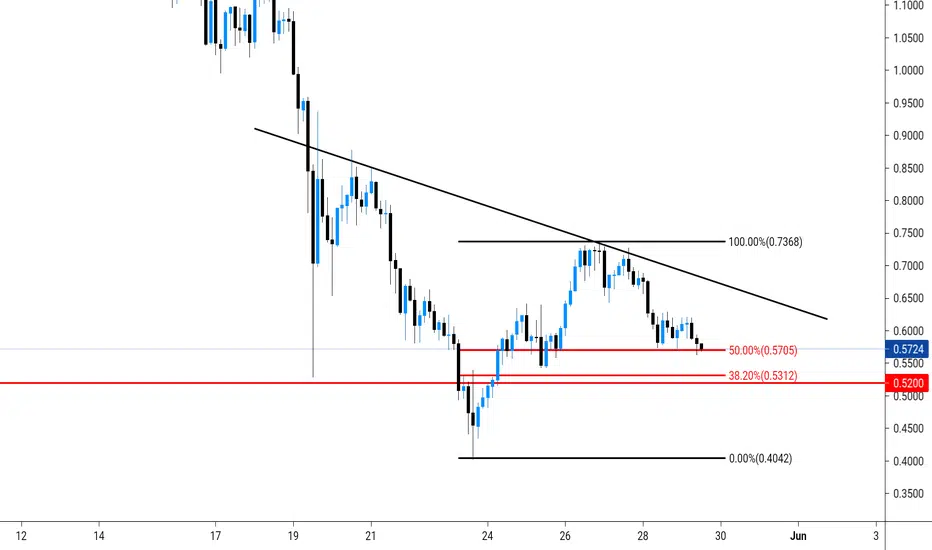
#OCEAN 3H USDT CHART ANALYSIS...
Ocean Now Just Above It's Weekly Strong Support Zone. If It's Can't Hold This Level, It Will Be More Bad For Ocean. So Weekly Candle Should Be Close Above Thid Support Zone 0.52$. On The Other Side It's Creating A Inverse Head & Shoulder Pattern. You Can Buy After Breakout The Neckline.
Short Term Trader Always Stop-loss. Invest How Much You Can Afford To Loss. Always Verify Your Own Analysis.
Ocean Now Just Above It's Weekly Strong Support Zone. If It's Can't Hold This Level, It Will Be More Bad For Ocean. So Weekly Candle Should Be Close Above Thid Support Zone 0.52$. On The Other Side It's Creating A Inverse Head & Shoulder Pattern. You Can Buy After Breakout The Neckline.
Short Term Trader Always Stop-loss. Invest How Much You Can Afford To Loss. Always Verify Your Own Analysis.

면책사항
해당 정보와 게시물은 금융, 투자, 트레이딩 또는 기타 유형의 조언이나 권장 사항으로 간주되지 않으며, 트레이딩뷰에서 제공하거나 보증하는 것이 아닙니다. 자세한 내용은 이용 약관을 참조하세요.
면책사항
해당 정보와 게시물은 금융, 투자, 트레이딩 또는 기타 유형의 조언이나 권장 사항으로 간주되지 않으며, 트레이딩뷰에서 제공하거나 보증하는 것이 아닙니다. 자세한 내용은 이용 약관을 참조하세요.