업데이트됨
OIL - Key Fibonacci Levels and Potential Market Moves
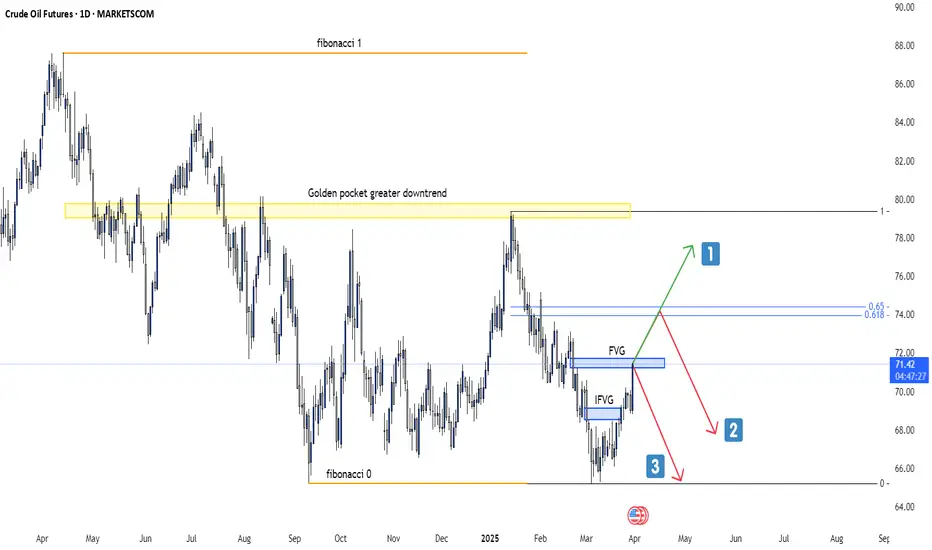
This chart presents a detailed technical analysis of Crude Oil Futures on the 1D timeframe, highlighting key Fibonacci levels, Fair Value Gaps (FVGs), and potential price movements.
Key observations:
- The price is currently around $71.44, moving towards a key decision zone.
- A significant Fibonacci retracement zone (0.618 - 0.65) is marked near $74, aligning with a key resistance area.
- The "Golden Pocket" from the greater downtrend remains a crucial area to watch for a potential reversal.
- Two Fair Value Gaps (FVG & IFVG) are identified, which could act as liquidity zones.
Possible Scenarios:
🟢 Option 1: Bullish breakout, price moves above $74 and continues toward $78+ levels.
🔴 Option 2: Rejection from resistance, leading to a potential pullback below $70.
🔴 Option 3: Strong rejection, price drops back towards the Fibonacci 0 level (~$64).
Which option do you think is most likely? Let me know your thoughts! 🚀📉
Key observations:
- The price is currently around $71.44, moving towards a key decision zone.
- A significant Fibonacci retracement zone (0.618 - 0.65) is marked near $74, aligning with a key resistance area.
- The "Golden Pocket" from the greater downtrend remains a crucial area to watch for a potential reversal.
- Two Fair Value Gaps (FVG & IFVG) are identified, which could act as liquidity zones.
Possible Scenarios:
🟢 Option 1: Bullish breakout, price moves above $74 and continues toward $78+ levels.
🔴 Option 2: Rejection from resistance, leading to a potential pullback below $70.
🔴 Option 3: Strong rejection, price drops back towards the Fibonacci 0 level (~$64).
Which option do you think is most likely? Let me know your thoughts! 🚀📉
액티브 트레이드
gap has been inversed!
MY LINKS
📈 Free Signals
bit.ly/3YxiRXr
💬 Discord Community
bit.ly/4jHHA3O
💵 Favorite Exchange
bit.ly/4lBeTXt
📈 Free Signals
bit.ly/3YxiRXr
💬 Discord Community
bit.ly/4jHHA3O
💵 Favorite Exchange
bit.ly/4lBeTXt
면책사항
해당 정보와 게시물은 금융, 투자, 트레이딩 또는 기타 유형의 조언이나 권장 사항으로 간주되지 않으며, 트레이딩뷰에서 제공하거나 보증하는 것이 아닙니다. 자세한 내용은 이용 약관을 참조하세요.
MY LINKS
📈 Free Signals
bit.ly/3YxiRXr
💬 Discord Community
bit.ly/4jHHA3O
💵 Favorite Exchange
bit.ly/4lBeTXt
📈 Free Signals
bit.ly/3YxiRXr
💬 Discord Community
bit.ly/4jHHA3O
💵 Favorite Exchange
bit.ly/4lBeTXt
면책사항
해당 정보와 게시물은 금융, 투자, 트레이딩 또는 기타 유형의 조언이나 권장 사항으로 간주되지 않으며, 트레이딩뷰에서 제공하거나 보증하는 것이 아닙니다. 자세한 내용은 이용 약관을 참조하세요.