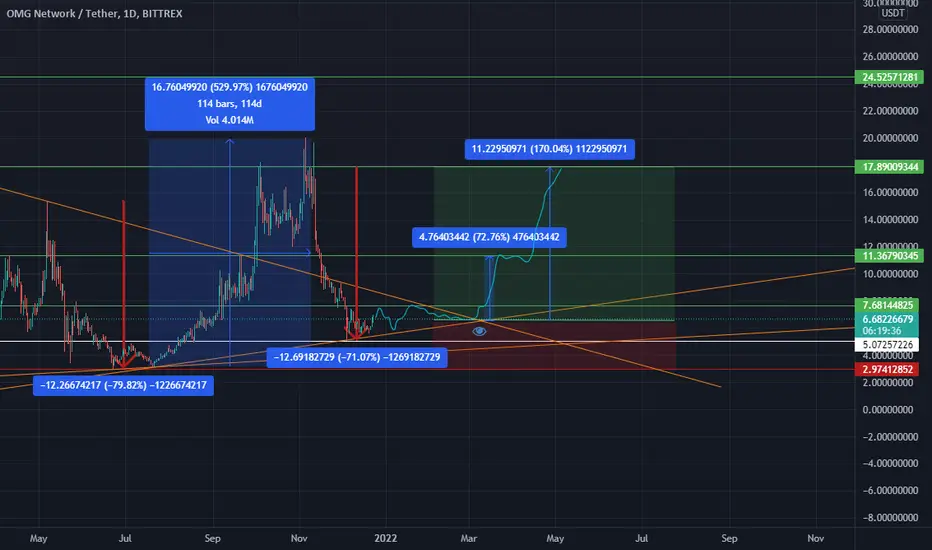
As you can see using the daily chart, the previous bear markets have crashed around 70% each time, highlighted with a RED price range arrow. We have now reached the 70% bear market, so previous history tells us we're on our way back up! We may see a slight dip during the holiday, but have faith we will rise.
The brushed line shows a possible scenario that could happen following previous trendlines.
Remember to set SL and TP along the way, feel free to use resistance as guidance!
The brushed line shows a possible scenario that could happen following previous trendlines.
Remember to set SL and TP along the way, feel free to use resistance as guidance!

면책사항
해당 정보와 게시물은 금융, 투자, 트레이딩 또는 기타 유형의 조언이나 권장 사항으로 간주되지 않으며, 트레이딩뷰에서 제공하거나 보증하는 것이 아닙니다. 자세한 내용은 이용 약관을 참조하세요.
면책사항
해당 정보와 게시물은 금융, 투자, 트레이딩 또는 기타 유형의 조언이나 권장 사항으로 간주되지 않으며, 트레이딩뷰에서 제공하거나 보증하는 것이 아닙니다. 자세한 내용은 이용 약관을 참조하세요.