
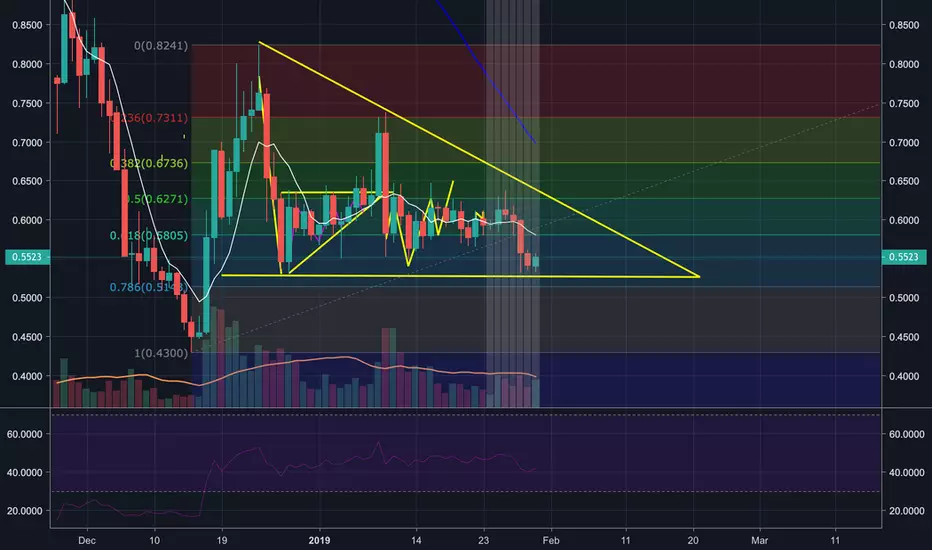
Hi kids. So ONT: USDT is clearly in a descending triangle, which is of course a bearish pattern. Looks like we may have one last trade around the 0,618 fib (0,58 USDT), which is now also a resistance line. but it's also possible that it will hit the triangle's resistance line around 0,60 - 0,61 USDT. That means you have a sell range of 0.58 to approximately 0,61 USDT. The 1day RSI supports an increase in price and on the 4h chart level you can see the MACD curving to the upside, thus starting a short run up to the resistance lines.
After that the sell-off will probably start. We can see that the first support line will be the FIB Line around 0,43 USDT, and if that breaks we will see much deeper levels.
Good luck with your trades.
**This information is not a recommendation to buy or sell. It is to be used for educational purposes only.***
See the 4H chart below
After that the sell-off will probably start. We can see that the first support line will be the FIB Line around 0,43 USDT, and if that breaks we will see much deeper levels.
Good luck with your trades.
**This information is not a recommendation to buy or sell. It is to be used for educational purposes only.***
See the 4H chart below
노트
노트
Seems like an double bottom has formed on the 1h chart just on the descending triangles support line. But volume isn't looking strong and the RSI is looking neutral right now. Lets see how the next candles will be closing; to see if we will get a move up.
면책사항
해당 정보와 게시물은 금융, 투자, 트레이딩 또는 기타 유형의 조언이나 권장 사항으로 간주되지 않으며, 트레이딩뷰에서 제공하거나 보증하는 것이 아닙니다. 자세한 내용은 이용 약관을 참조하세요.
면책사항
해당 정보와 게시물은 금융, 투자, 트레이딩 또는 기타 유형의 조언이나 권장 사항으로 간주되지 않으며, 트레이딩뷰에서 제공하거나 보증하는 것이 아닙니다. 자세한 내용은 이용 약관을 참조하세요.