
Hi My friends,
I've discovered a pretty interesting trading setup.
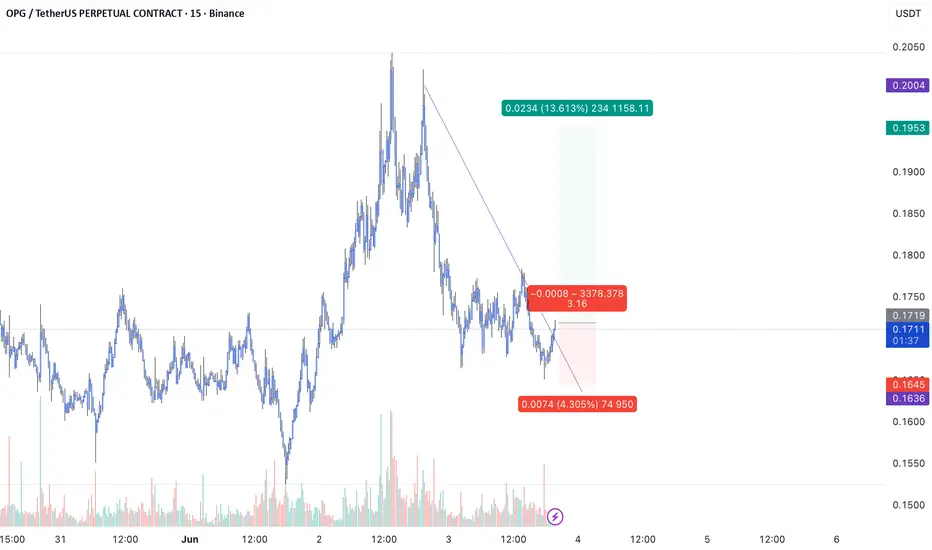
1. Breakout Above the Downtrend Line
Price had been forming lower highs along the descending trendline (purple line).
The latest move has broken above the trendline, suggesting that short-term selling pressure is weakening.
This is often an early signal of a reversal or at least a relief rally.
2. Formation of Higher Lows
The support area around 0.166–0.167 has held successfully.
Price is now beginning to form higher lows, which is one of the first signs of a potential bullish structure.
3. Volume Supports the Move
Near the recent lows, several volume spikes appeared above average levels.
This suggests that buyers may be absorbing selling pressure and stepping into the market.
4. Attractive Risk-to-Reward Ratio
Based on your setup:
Entry: ~0.1718
Stop Loss: ~0.1645
Take Profit: ~0.1953
Risk-to-Reward Ratio ≈ 3.16:1
I've discovered a pretty interesting trading setup.
1. Breakout Above the Downtrend Line
Price had been forming lower highs along the descending trendline (purple line).
The latest move has broken above the trendline, suggesting that short-term selling pressure is weakening.
This is often an early signal of a reversal or at least a relief rally.
2. Formation of Higher Lows
The support area around 0.166–0.167 has held successfully.
Price is now beginning to form higher lows, which is one of the first signs of a potential bullish structure.
3. Volume Supports the Move
Near the recent lows, several volume spikes appeared above average levels.
This suggests that buyers may be absorbing selling pressure and stepping into the market.
4. Attractive Risk-to-Reward Ratio
Based on your setup:
Entry: ~0.1718
Stop Loss: ~0.1645
Take Profit: ~0.1953
Risk-to-Reward Ratio ≈ 3.16:1

면책사항
해당 정보와 게시물은 금융, 투자, 트레이딩 또는 기타 유형의 조언이나 권장 사항으로 간주되지 않으며, 트레이딩뷰에서 제공하거나 보증하는 것이 아닙니다. 자세한 내용은 이용 약관을 참조하세요.
면책사항
해당 정보와 게시물은 금융, 투자, 트레이딩 또는 기타 유형의 조언이나 권장 사항으로 간주되지 않으며, 트레이딩뷰에서 제공하거나 보증하는 것이 아닙니다. 자세한 내용은 이용 약관을 참조하세요.