
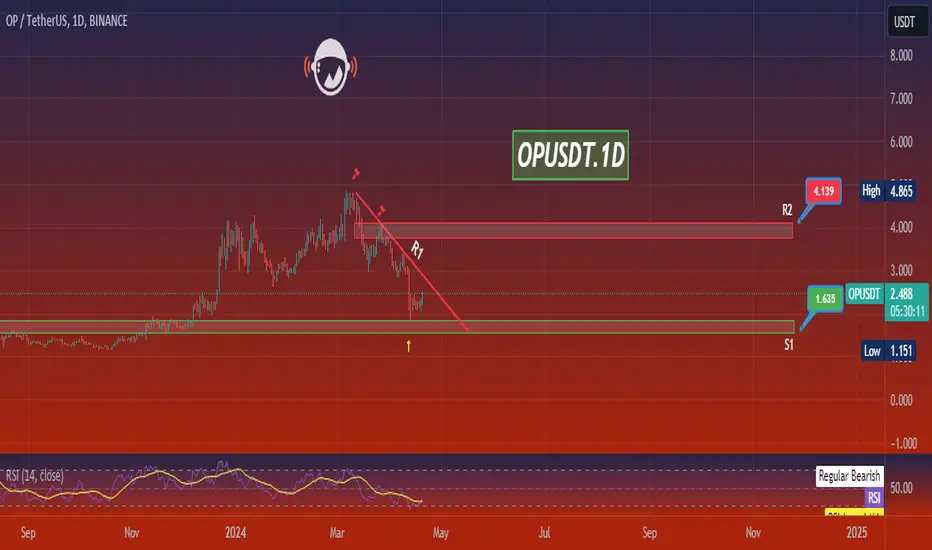
The daily chart for Optimism (OP/USDT) illustrates a bearish trend with a series of lower highs and lower lows, which can be interpreted as a downtrend channel. The price is currently hovering near $2.467, with a clear support level at $1.635. The resistance level at $4.139 is crucial; a breakout above this level could signal a potential trend reversal. However, the current price action remains below this resistance, suggesting that the bearish sentiment is still dominant.
Traders might look for short positions as long as the price is below the resistance level, with potential targets near the support level. A break above the resistance could invalidate the bearish outlook and shift the strategy towards looking for buying opportunities. Risk management is key, and stop losses should be considered above the resistance level when taking short positions to protect against sudden bullish reversals.
Traders might look for short positions as long as the price is below the resistance level, with potential targets near the support level. A break above the resistance could invalidate the bearish outlook and shift the strategy towards looking for buying opportunities. Risk management is key, and stop losses should be considered above the resistance level when taking short positions to protect against sudden bullish reversals.

면책사항
해당 정보와 게시물은 금융, 투자, 트레이딩 또는 기타 유형의 조언이나 권장 사항으로 간주되지 않으며, 트레이딩뷰에서 제공하거나 보증하는 것이 아닙니다. 자세한 내용은 이용 약관을 참조하세요.
면책사항
해당 정보와 게시물은 금융, 투자, 트레이딩 또는 기타 유형의 조언이나 권장 사항으로 간주되지 않으며, 트레이딩뷰에서 제공하거나 보증하는 것이 아닙니다. 자세한 내용은 이용 약관을 참조하세요.