
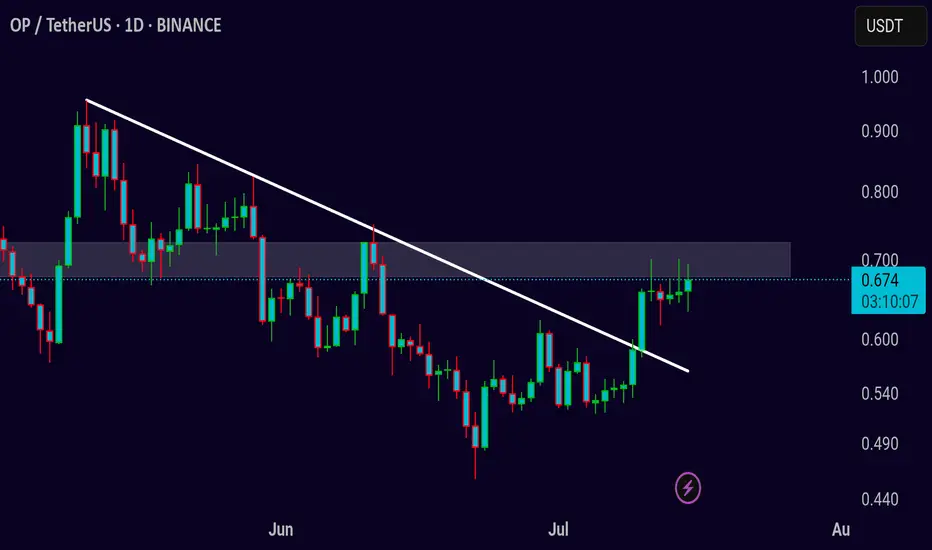
Symbol: OP/USDT
Timeframe: Daily
Chart Analysis:
The price is currently approaching a key resistance zone at around 0.673, as seen in the chart. A descending trendline from May to June has been acting as resistance. The price has recently made a strong move towards this resistance zone, showing a potential breakout pattern.
If the price successfully breaks above the 0.673 resistance, we could see a bullish continuation towards the next resistance levels, potentially up to 0.700 or higher. The breakout would suggest a reversal of the prior downtrend.
Key Levels:
* Resistance: 0.673 (current resistance zone)
* Support: 0.600 (lower support area)
Trade Strategy:
1. Long Entry: Consider entering a long position if the price breaks above the 0.673 resistance with strong volume.
2. Target: A reasonable target could be the 0.700 region. Keep an eye on price action as it approaches this level.
3. Stop Loss: Place a stop loss below the 0.600 support to manage risk in case of a failed breakout.
Risk-Reward: A potential reward-to-risk ratio of 2:1 or better, depending on entry and exit points.
Conclusion:
Monitor the price closely for a breakout above the 0.673 level. If it breaks and sustains, a bullish move could follow. Watch for volume confirmation and market momentum to gauge the strength of the breakout.

면책사항
해당 정보와 게시물은 금융, 투자, 트레이딩 또는 기타 유형의 조언이나 권장 사항으로 간주되지 않으며, 트레이딩뷰에서 제공하거나 보증하는 것이 아닙니다. 자세한 내용은 이용 약관을 참조하세요.
면책사항
해당 정보와 게시물은 금융, 투자, 트레이딩 또는 기타 유형의 조언이나 권장 사항으로 간주되지 않으며, 트레이딩뷰에서 제공하거나 보증하는 것이 아닙니다. 자세한 내용은 이용 약관을 참조하세요.