
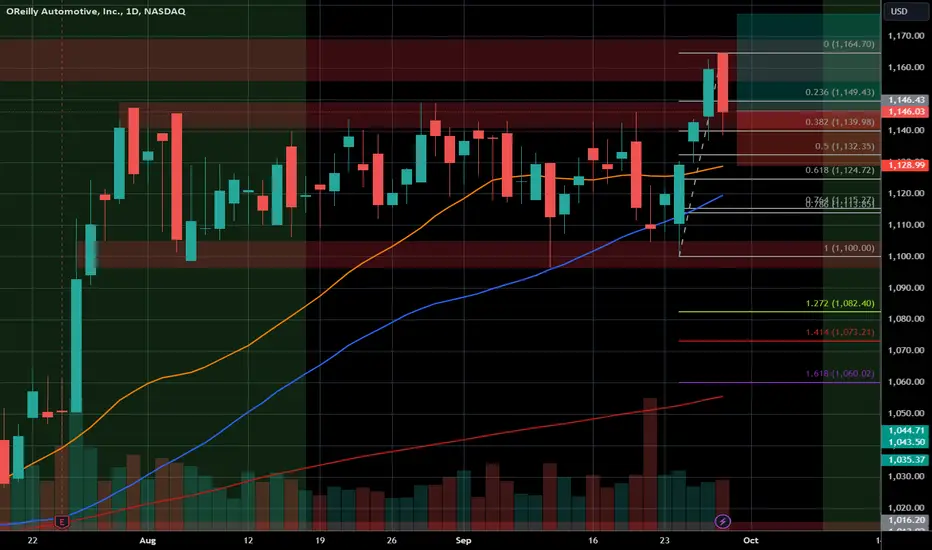
I've entered a long position in $ORLY. Since this US stock reached its high in late July of this year, it has been continuously in a sideways correction, which is very bullish. In the last few trading days, it broke out of this channel to the upside and re-tested it on the last trading day.
The price is currently supported by the 38.2% Fibonacci level, the upper boundary of the broken channel, and the moving averages are catching up.
Let's see if this setup plays out as expected.
The price is currently supported by the 38.2% Fibonacci level, the upper boundary of the broken channel, and the moving averages are catching up.
Let's see if this setup plays out as expected.
매매 수동청산
Closed the position with a green 0
면책사항
해당 정보와 게시물은 금융, 투자, 트레이딩 또는 기타 유형의 조언이나 권장 사항으로 간주되지 않으며, 트레이딩뷰에서 제공하거나 보증하는 것이 아닙니다. 자세한 내용은 이용 약관을 참조하세요.
면책사항
해당 정보와 게시물은 금융, 투자, 트레이딩 또는 기타 유형의 조언이나 권장 사항으로 간주되지 않으며, 트레이딩뷰에서 제공하거나 보증하는 것이 아닙니다. 자세한 내용은 이용 약관을 참조하세요.