
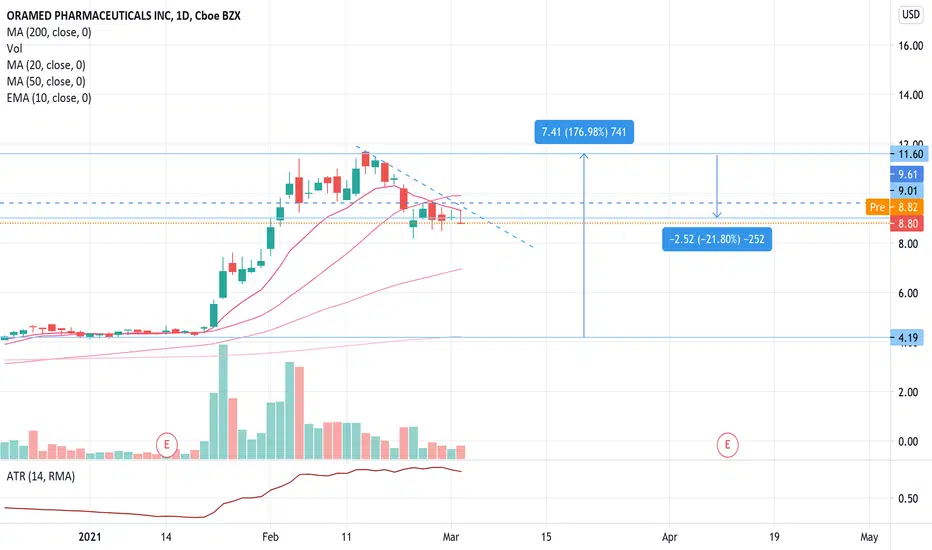
High tight flag chart pattern forms when a stock rises over 90% (preferably 100%) or more in two months, then consolidates sideways for 15-25 days with a decline of no more than 25%. When there's a breakout of the sideways 'flag' on high volume , the powerful uptrend often resumes.
The entry point is either as the stock breaks the high of the flag or breaks a downtrend line - but only ever on higher than average volume.
Looking for an entry if it breaks back above the moving average lines on higher than average volume. ATR and volume declining recently is a good sign.
The entry point is either as the stock breaks the high of the flag or breaks a downtrend line - but only ever on higher than average volume.
Looking for an entry if it breaks back above the moving average lines on higher than average volume. ATR and volume declining recently is a good sign.

면책사항
해당 정보와 게시물은 금융, 투자, 트레이딩 또는 기타 유형의 조언이나 권장 사항으로 간주되지 않으며, 트레이딩뷰에서 제공하거나 보증하는 것이 아닙니다. 자세한 내용은 이용 약관을 참조하세요.
면책사항
해당 정보와 게시물은 금융, 투자, 트레이딩 또는 기타 유형의 조언이나 권장 사항으로 간주되지 않으며, 트레이딩뷰에서 제공하거나 보증하는 것이 아닙니다. 자세한 내용은 이용 약관을 참조하세요.