
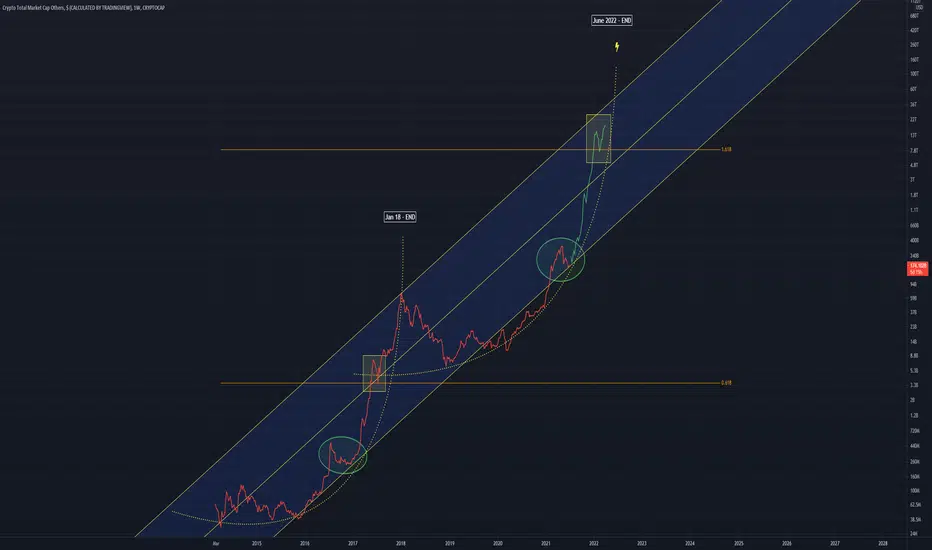
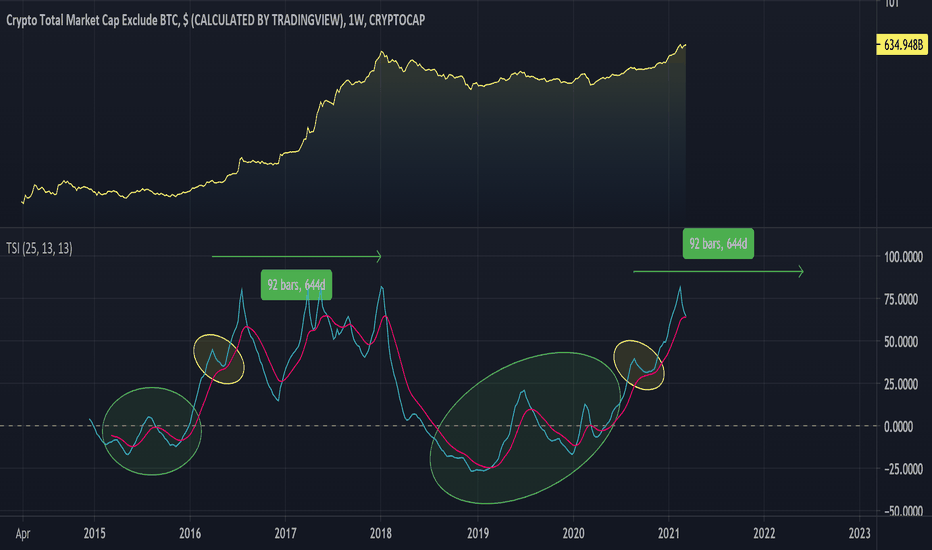
Many of my charts are suggesting a June 2022 end to the bull market
Similar price points can be seen at .618 and 1.618
The curved pattern is pretty cool to observe, I wonder if it will continue further upwards
We are currently in the green circle, a pullback after a bull run, preparing us for the bigger second phase bull run, which is plotted after the green circle
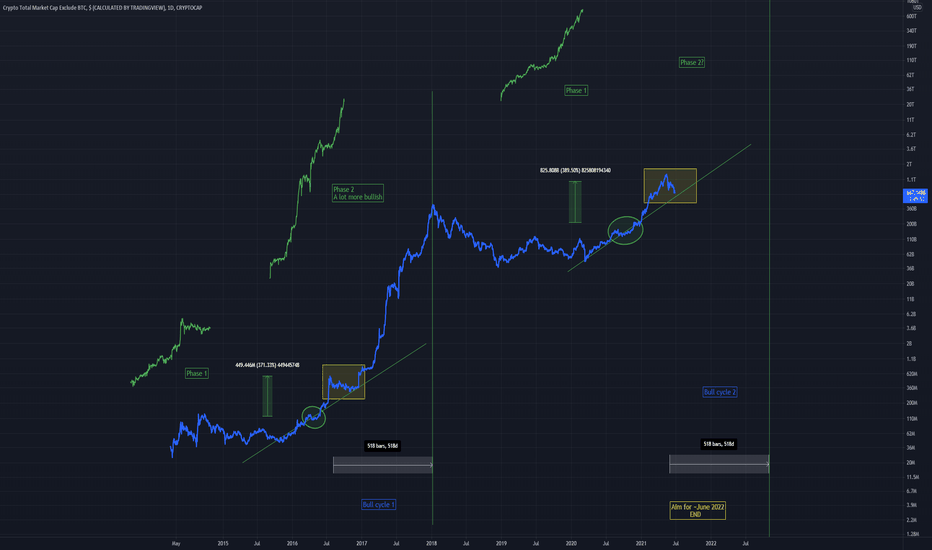
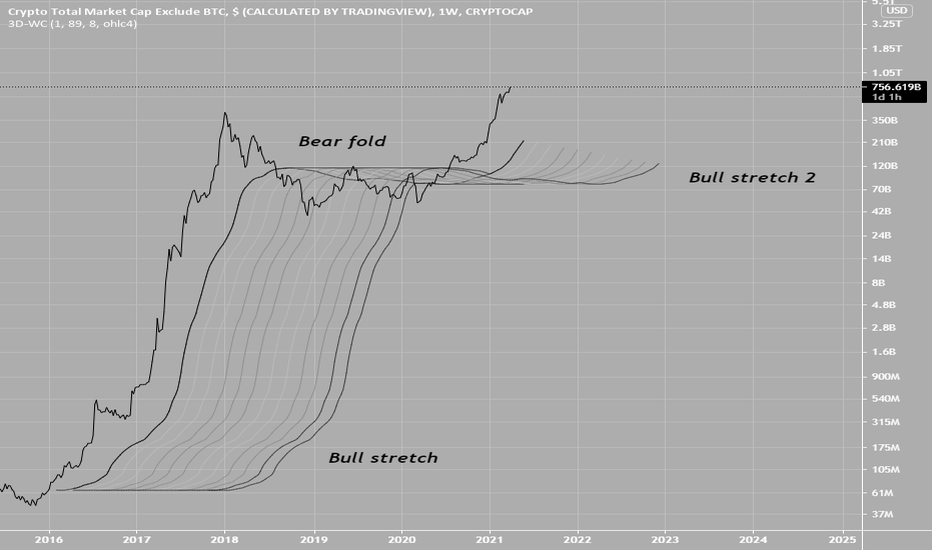
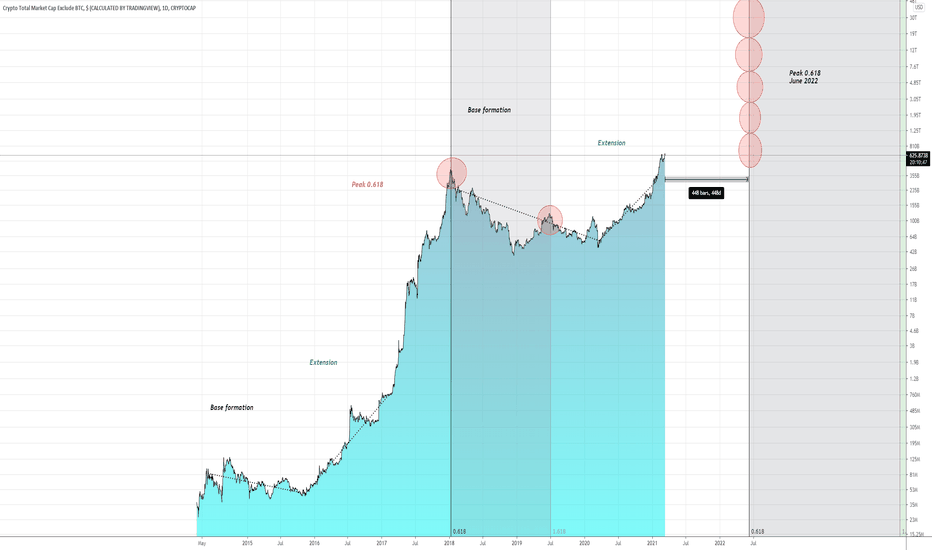
This chart above also suggest June 2022
Similar price points can be seen at .618 and 1.618
The curved pattern is pretty cool to observe, I wonder if it will continue further upwards
We are currently in the green circle, a pullback after a bull run, preparing us for the bigger second phase bull run, which is plotted after the green circle
This chart above also suggest June 2022

면책사항
해당 정보와 게시물은 금융, 투자, 트레이딩 또는 기타 유형의 조언이나 권장 사항으로 간주되지 않으며, 트레이딩뷰에서 제공하거나 보증하는 것이 아닙니다. 자세한 내용은 이용 약관을 참조하세요.
면책사항
해당 정보와 게시물은 금융, 투자, 트레이딩 또는 기타 유형의 조언이나 권장 사항으로 간주되지 않으며, 트레이딩뷰에서 제공하거나 보증하는 것이 아닙니다. 자세한 내용은 이용 약관을 참조하세요.