
🧭 Timeframe & Context
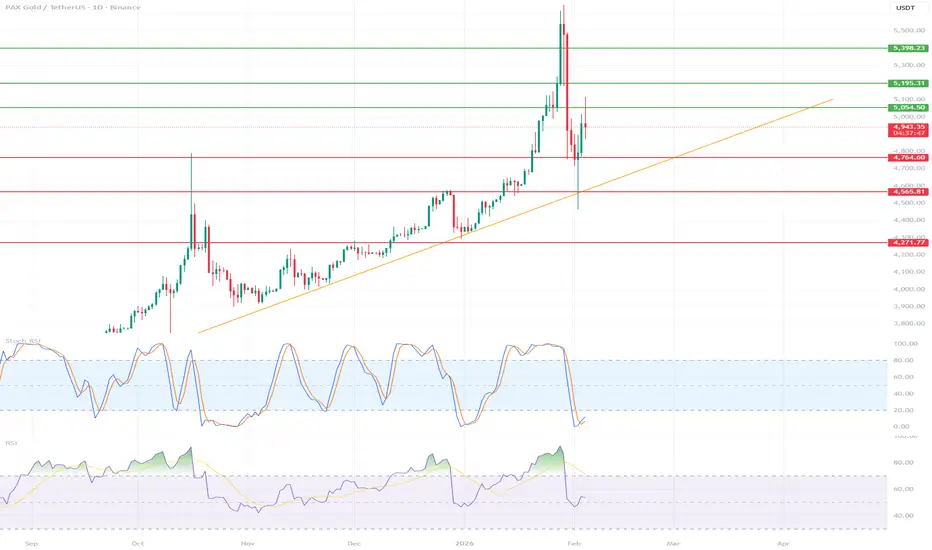
PAXG / USDT – D1
Strong uptrend for many months (clear HH/HL sequence)
Last move: impulse + very aggressive correction (long wick + dump)
📈 Main Trend
The uptrend is still in effect, but:
The market is in a correction phase after the euphoria
The short-term structure has been breached
🟠 Trendline (orange)
Price has broken below / is testing it from above → a key decision point
🔑 Levels (most important)
🟢 Resistance
5,054 – local resistance / reaction zone
5,195 – 5,235 – strong supply zone (this was a fake breakout)
5,398 – ATH / market ceiling
🔴 Support
4,960 – 4 950 – current combat zone
4,764 – very important HL (loss = deeper correction)
4,565 – key structural support
4,277 – "last line of defense" of the D1 trend
📉 RSI & Stoch RSI
RSI (D1)
Drop from high levels → market cooling
Still above 50 → uptrend not broken yet
No bullish divergence (yet)
Stoch RSI
Coming out of oversold
This offers potential for a short-term bounce, but:
bounce ≠ trend reversal
🧠 What's really happening here?
This is a classic pattern:
🚀 Strong impulse (FOMO)
❌ False breakout + liquidity dump
🔄 The market is testing whether the bulls still have fuel
🎯 Scenarios
🟢 Bullish (more likely if…)
We hold 4,950–4,960
We return above 5,054
Targets:
5,195
5,398 (ATH)
🔴 Bearish (if…)
D1 close below 4,764
Then:
4,565
4,277 as a deep pullback

면책사항
해당 정보와 게시물은 금융, 투자, 트레이딩 또는 기타 유형의 조언이나 권장 사항으로 간주되지 않으며, 트레이딩뷰에서 제공하거나 보증하는 것이 아닙니다. 자세한 내용은 이용 약관을 참조하세요.
면책사항
해당 정보와 게시물은 금융, 투자, 트레이딩 또는 기타 유형의 조언이나 권장 사항으로 간주되지 않으며, 트레이딩뷰에서 제공하거나 보증하는 것이 아닙니다. 자세한 내용은 이용 약관을 참조하세요.