
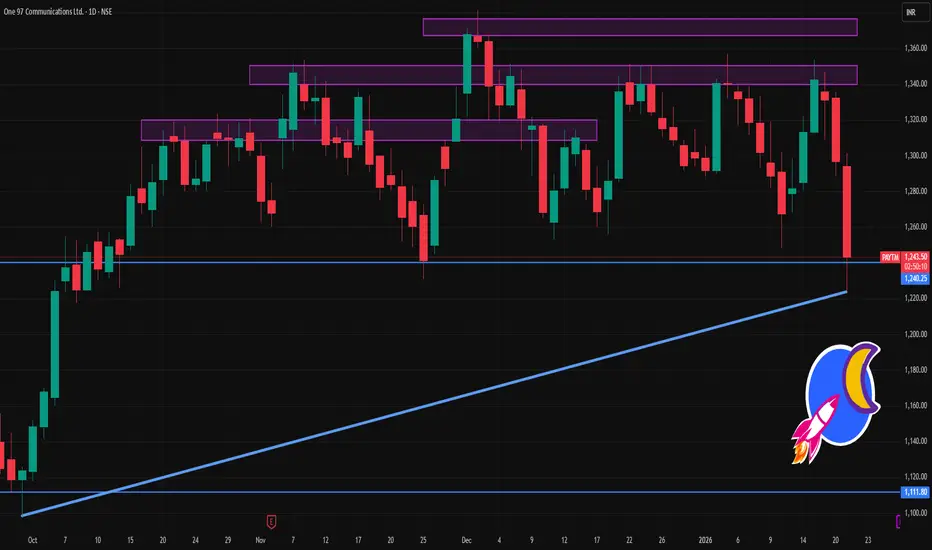
📌 Live/Recent Price:
Around ₹1,240 – ₹1,300 range intra‑day (varying by source/time) — showing recent session weakness.
📊 Daily Pivot & Support/Resistance Levels
These levels are typical pivot analysis (daily frame) used by traders to identify short‑term sell/buy pressure points:
Pivot Zone (Daily): ~₹1,307–1,325
Resistances:
R1: ₹1,325–₹1,330
R2: ₹1,354–₹1,355
R3: ₹1,372–₹1,373
Supports:
S1: ~₹1,278–₹1,280
S2: ~₹1,259–₹1,260
S3: ~₹1,231–₹1,232**
📌 Interpretation:
Above Pivot (₹1,307–₹1,325) ➜ short‑term bullish bias.
Below Pivot ➜ bearish bias with S1→S2 as key downside zones today.
🧠 Key Daily Zones to Watch
🎯 Bullish Break Zones
Strong intraday upside trigger: RSI/Vol can push price back above ₹1,307 pivot
Next upside targets: ₹1,325 → ₹1,354 → ₹1,372
⚠️ Bearish Breakdown Zones
If drops below S1 (~₹1,278), next key downside to watch is ₹1,259 (S2)
Breaking below ₹1,231 (S3) may accelerate intraday selling
Around ₹1,240 – ₹1,300 range intra‑day (varying by source/time) — showing recent session weakness.
📊 Daily Pivot & Support/Resistance Levels
These levels are typical pivot analysis (daily frame) used by traders to identify short‑term sell/buy pressure points:
Pivot Zone (Daily): ~₹1,307–1,325
Resistances:
R1: ₹1,325–₹1,330
R2: ₹1,354–₹1,355
R3: ₹1,372–₹1,373
Supports:
S1: ~₹1,278–₹1,280
S2: ~₹1,259–₹1,260
S3: ~₹1,231–₹1,232**
📌 Interpretation:
Above Pivot (₹1,307–₹1,325) ➜ short‑term bullish bias.
Below Pivot ➜ bearish bias with S1→S2 as key downside zones today.
🧠 Key Daily Zones to Watch
🎯 Bullish Break Zones
Strong intraday upside trigger: RSI/Vol can push price back above ₹1,307 pivot
Next upside targets: ₹1,325 → ₹1,354 → ₹1,372
⚠️ Bearish Breakdown Zones
If drops below S1 (~₹1,278), next key downside to watch is ₹1,259 (S2)
Breaking below ₹1,231 (S3) may accelerate intraday selling

Contact Knowledgehub for a detailed consultation: Dm on WhatsApp: [wa.link/a2o0kz]-
Phone No: [+91 93102 26243]-
Email: [tradingviewknowledgehub@gmail.com]---
-- Let’s achieve success together!
Phone No: [+91 93102 26243]-
Email: [tradingviewknowledgehub@gmail.com]---
-- Let’s achieve success together!
관련 발행물
면책사항
해당 정보와 게시물은 금융, 투자, 트레이딩 또는 기타 유형의 조언이나 권장 사항으로 간주되지 않으며, 트레이딩뷰에서 제공하거나 보증하는 것이 아닙니다. 자세한 내용은 이용 약관을 참조하세요.
Contact Knowledgehub for a detailed consultation: Dm on WhatsApp: [wa.link/a2o0kz]-
Phone No: [+91 93102 26243]-
Email: [tradingviewknowledgehub@gmail.com]---
-- Let’s achieve success together!
Phone No: [+91 93102 26243]-
Email: [tradingviewknowledgehub@gmail.com]---
-- Let’s achieve success together!
관련 발행물
면책사항
해당 정보와 게시물은 금융, 투자, 트레이딩 또는 기타 유형의 조언이나 권장 사항으로 간주되지 않으며, 트레이딩뷰에서 제공하거나 보증하는 것이 아닙니다. 자세한 내용은 이용 약관을 참조하세요.