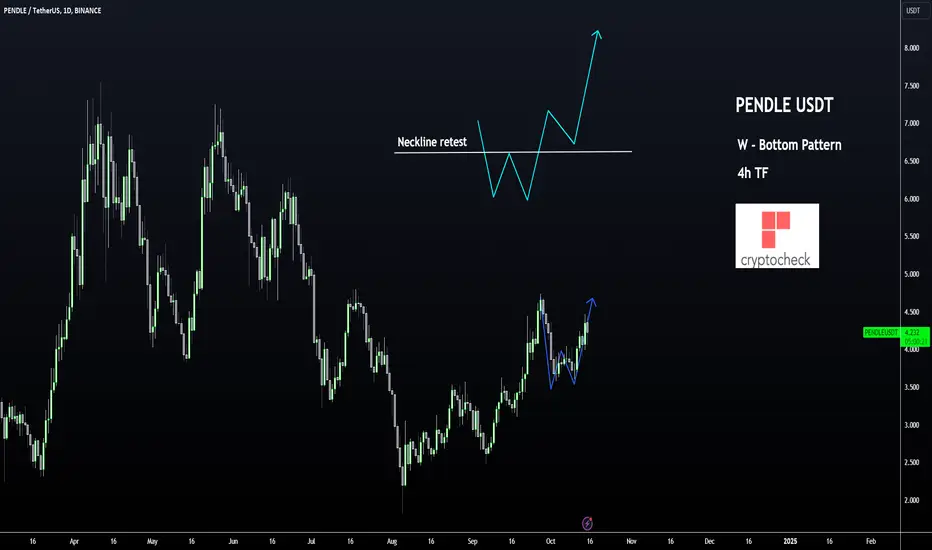
PENDLE has formed a W-Bottom Chart Pattern in the Daily timeframe, which could signal more upside is coming.
We're also observing very distinctive higher lows and higher highs; a key sign of a bullish market.
The W-Bottom pattern hasn't quite finished playing out, what we now need to see is a successful retest of support at the "neckline" which is currently at $4. What this means in simpler terms, is that the price cannot CLOSE below this, otherwise the pattern is invalidated.
We're also observing a BUY signal in the weekly timeframe; a strong indication that bulls are in control for the near future:

If the pattern holds, the price is likely heading towards the previous local high of $4.7

_______________________________

 PENDLEUSDT
We're also observing very distinctive higher lows and higher highs; a key sign of a bullish market.
The W-Bottom pattern hasn't quite finished playing out, what we now need to see is a successful retest of support at the "neckline" which is currently at $4. What this means in simpler terms, is that the price cannot CLOSE below this, otherwise the pattern is invalidated.
We're also observing a BUY signal in the weekly timeframe; a strong indication that bulls are in control for the near future:
If the pattern holds, the price is likely heading towards the previous local high of $4.7
_______________________________
PENDLEUSDT 
Discord Server
discord.gg/xHJRka3
Cryptocheck Website
thecryptocheck.com
SoftQuant Website
softquant.io
discord.gg/xHJRka3
Cryptocheck Website
thecryptocheck.com
SoftQuant Website
softquant.io
관련 발행물
면책사항
해당 정보와 게시물은 금융, 투자, 트레이딩 또는 기타 유형의 조언이나 권장 사항으로 간주되지 않으며, 트레이딩뷰에서 제공하거나 보증하는 것이 아닙니다. 자세한 내용은 이용 약관을 참조하세요.
Discord Server
discord.gg/xHJRka3
Cryptocheck Website
thecryptocheck.com
SoftQuant Website
softquant.io
discord.gg/xHJRka3
Cryptocheck Website
thecryptocheck.com
SoftQuant Website
softquant.io
관련 발행물
면책사항
해당 정보와 게시물은 금융, 투자, 트레이딩 또는 기타 유형의 조언이나 권장 사항으로 간주되지 않으며, 트레이딩뷰에서 제공하거나 보증하는 것이 아닙니다. 자세한 내용은 이용 약관을 참조하세요.