
STRONG BUY Setup 💻
Entry: ₹6,316-6,340 (Current Level)
Target 1: ₹6,474-6,500
Target 2: ₹6,587-6,620
Target 3: ₹6,700-6,750
Target 4: ₹6,900-7,000+ (Extended Breakout Target)
Stop Loss: ₹6,082
Technical Rationale:
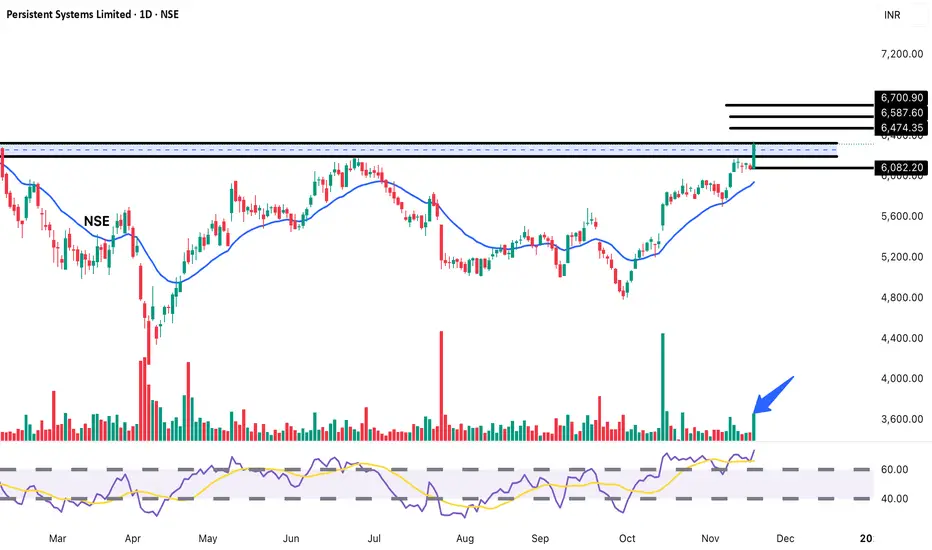
MASSIVE BREAKOUT from year-long resistance at 6,250 (horizontal black line at top)
Explosive +3.89% surge with exceptional volume spike (874.8K - highlighted with blue arrow)
Breaking above major resistance zone decisively on daily chart
Trading above long-term horizontal resistance after multiple tests throughout 2025
Volume is highest in months - institutional buying evident
Strong uptrend intact - trading above rising EMA (blue curve)
RSI around 65-70 - strong bullish momentum with room for upside
IT Services sector showing strength - digital transformation demand
Multiple resistance levels mapped: 6,474, 6,587, 6,700
Clear support established at breakout zone 6,250 and 6,082
Previous all-time high territory being challenged
Pattern shows consistent higher lows since October bottom
Risk-Reward: Excellent 1:2.5 to 1:4+ ratio depending on targets
Pattern: HORIZONTAL RESISTANCE BREAKOUT on DAILY Chart - breaking year-long ceiling with exceptional volume
Strategy: Medium-term swing to positional (weeks to months)
Book 20% at T1 (6,490), 20% at T2 (6,600), 20% at T3 (6,725)
Hold remaining 40% for extended target 6,900-7,000+
Trail SL to 6,320 after crossing T1
Disclaimer: For educational purposes only. Not SEBI registered.
액티브 트레이드
Target 1: ₹6,474-6,500 done
면책사항
해당 정보와 게시물은 금융, 투자, 트레이딩 또는 기타 유형의 조언이나 권장 사항으로 간주되지 않으며, 트레이딩뷰에서 제공하거나 보증하는 것이 아닙니다. 자세한 내용은 이용 약관을 참조하세요.
면책사항
해당 정보와 게시물은 금융, 투자, 트레이딩 또는 기타 유형의 조언이나 권장 사항으로 간주되지 않으며, 트레이딩뷰에서 제공하거나 보증하는 것이 아닙니다. 자세한 내용은 이용 약관을 참조하세요.