
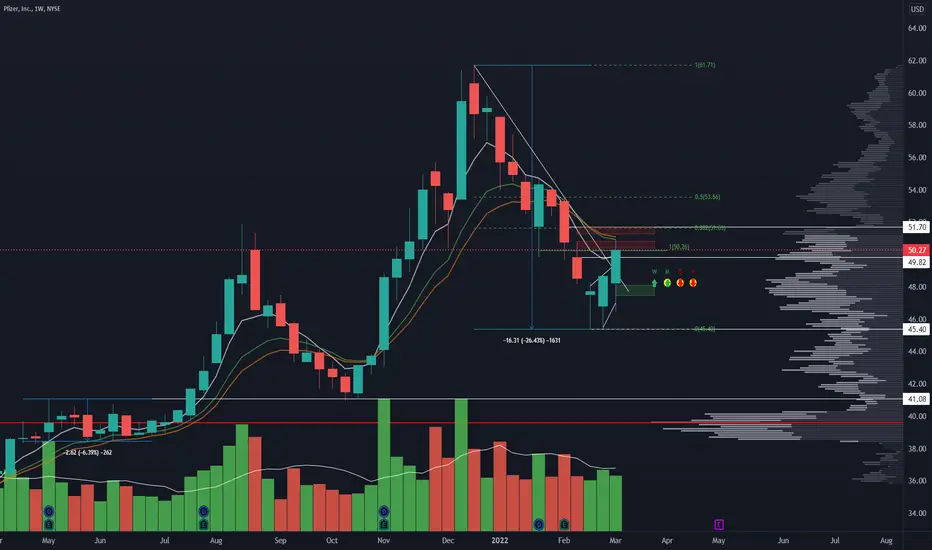
PFE Weekly Chart :
- Broke Downtrend trend line.
- Meet 10 EMA on the weekly = important resistance : we are seeing rejection of the 51-50 levels.
- Holding 48$ level is crucial for PFE to stay in it current uptrend. Above 51 PFE will likely go for the gap fill to reach around 52.70.
- With current market condition it is probable to have some kind of pullback next week : key point here is we need to see lower volume pullback with smaller candle than green candle. Optimal scenario is that we see a bounce back immediately after a pullback. That will signal relative strength and constant buying of the stock.

면책사항
해당 정보와 게시물은 금융, 투자, 트레이딩 또는 기타 유형의 조언이나 권장 사항으로 간주되지 않으며, 트레이딩뷰에서 제공하거나 보증하는 것이 아닙니다. 자세한 내용은 이용 약관을 참조하세요.
면책사항
해당 정보와 게시물은 금융, 투자, 트레이딩 또는 기타 유형의 조언이나 권장 사항으로 간주되지 않으며, 트레이딩뷰에서 제공하거나 보증하는 것이 아닙니다. 자세한 내용은 이용 약관을 참조하세요.