PFIE Analysis
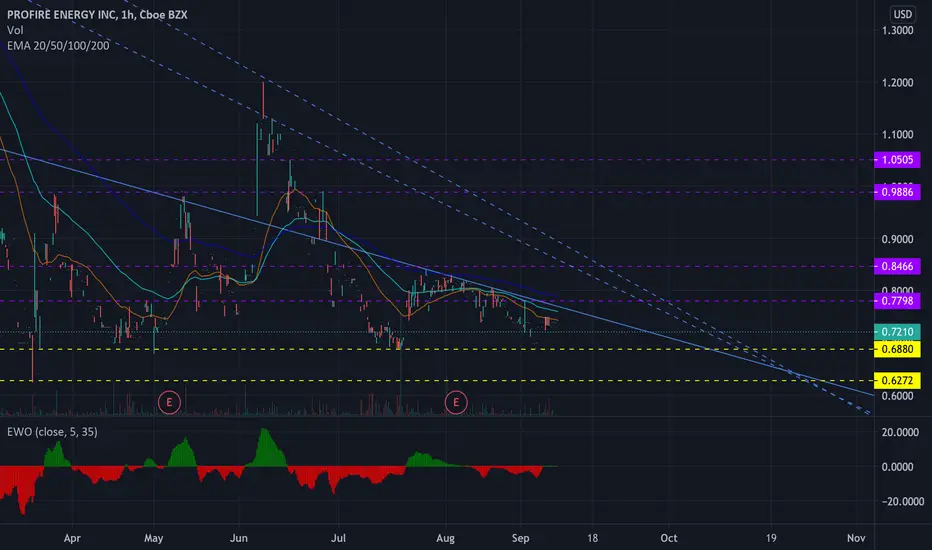
Recently, PFIE has been trading under its 20 EMA, indicating weakness. However, if PFIE can climb above .78, it could see higher highs, and a break above the current resistance represented by the full blue line could bring even higher levels towards to the purple resistance levels. However, PFIE has been holding .688 level very well -- a bounce off this level is imminent, but if it trend below this line, there's still a gap to fill down to .62.

면책사항
해당 정보와 게시물은 금융, 투자, 트레이딩 또는 기타 유형의 조언이나 권장 사항으로 간주되지 않으며, 트레이딩뷰에서 제공하거나 보증하는 것이 아닙니다. 자세한 내용은 이용 약관을 참조하세요.
면책사항
해당 정보와 게시물은 금융, 투자, 트레이딩 또는 기타 유형의 조언이나 권장 사항으로 간주되지 않으며, 트레이딩뷰에서 제공하거나 보증하는 것이 아닙니다. 자세한 내용은 이용 약관을 참조하세요.