 PGR
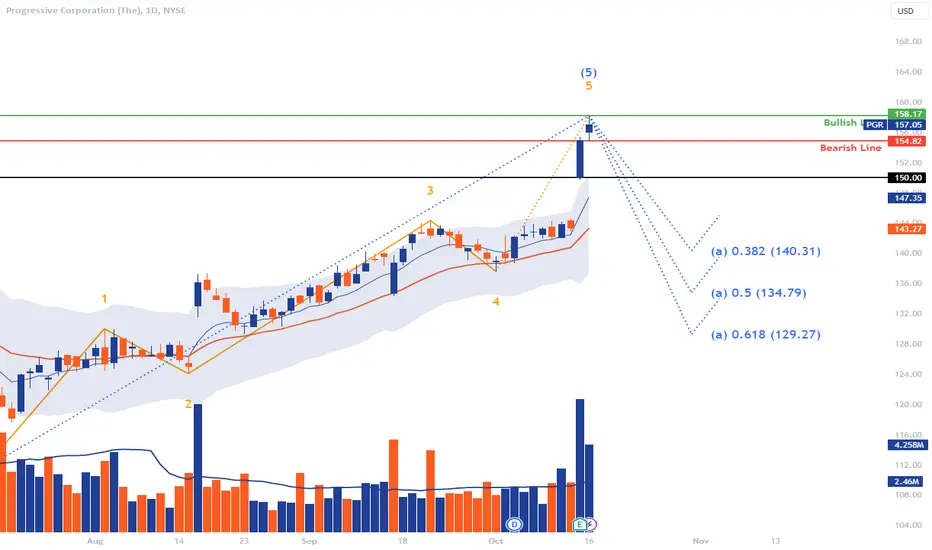
*I'm bearish on this, because it's overbought and also based on EW, we should expect the rejection. but here are the both scenarios.
If the stock price surpasses the bullish line at approximately $157.05, the immediate upside target could be:
Bullish Target Price 1: Drawing an inference based on the chart's pattern, considering the amplitude of prior upward moves (such as the move from point 2 to 3), a potential target could be around $165-167. However, this is an approximation, and exact figures may vary.
If the stock price falls below the bearish line at $154.82, there are a few potential downside retracement targets based on Fibonacci levels:
(a) 0.382 retracement at $140.31.
(a) 0.5 retracement at $134.79.
(a) 0.618 retracement at $129.27.
These levels are based on the Elliott Wave and Fibonacci retracement which predicts potential retracement levels after a significant move.

no pain, no gain
Unveiling illusions, revealing wealth
Unveiling illusions, revealing wealth
면책사항
해당 정보와 게시물은 금융, 투자, 트레이딩 또는 기타 유형의 조언이나 권장 사항으로 간주되지 않으며, 트레이딩뷰에서 제공하거나 보증하는 것이 아닙니다. 자세한 내용은 이용 약관을 참조하세요.
no pain, no gain
Unveiling illusions, revealing wealth
Unveiling illusions, revealing wealth
면책사항
해당 정보와 게시물은 금융, 투자, 트레이딩 또는 기타 유형의 조언이나 권장 사항으로 간주되지 않으며, 트레이딩뷰에서 제공하거나 보증하는 것이 아닙니다. 자세한 내용은 이용 약관을 참조하세요.