
hey Guys,
- Yearly Chart is bullish, Double Bottom and Engulfing Candle.
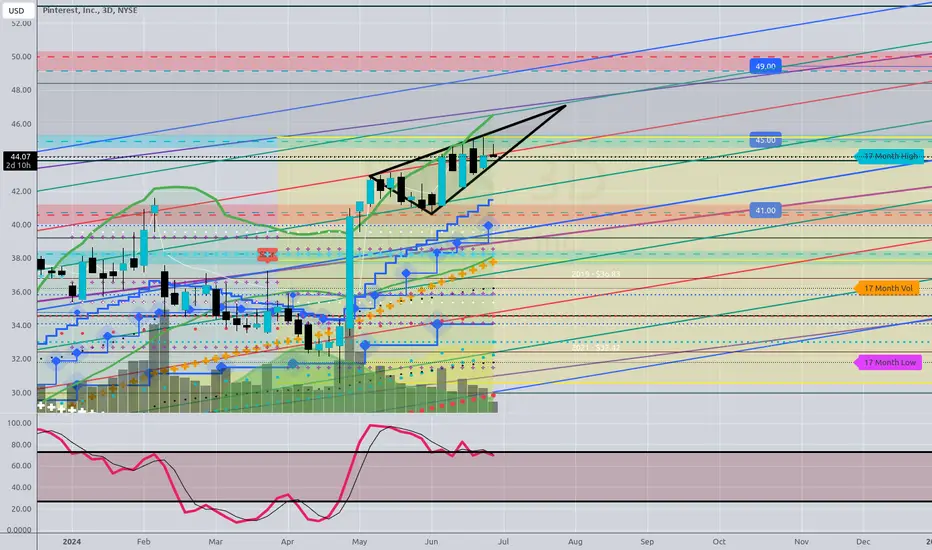
->Targets … 41 … 45 … 49.
Quarterly: Bullish Candle breakout above the Highs of Q1.
-> But it is retesting a major supply line and a yearly FIB. - creating a Grey Zone which divides the Stock into a bearish zone below and bullish zone above.
Monthly: Bullish candle - Stochastic Bullish but OB.
-> caution as we could see some Profit taking / reloading at lower prices.
3D: Signs of a possible reversal: Ascending Triangle, Fifth Wave, Diagonal Moving Stock (Distortion?)
Breakout to the upside would be extremely bullish…
Lower prices could be seen as a great buying opportunity.
targets Bears: 41 38
Targets Bulls: 45 49
Please let me know if you would like me to analyse an Instrument for you.
Thanks for reading
- Yearly Chart is bullish, Double Bottom and Engulfing Candle.
->Targets … 41 … 45 … 49.
Quarterly: Bullish Candle breakout above the Highs of Q1.
-> But it is retesting a major supply line and a yearly FIB. - creating a Grey Zone which divides the Stock into a bearish zone below and bullish zone above.
Monthly: Bullish candle - Stochastic Bullish but OB.
-> caution as we could see some Profit taking / reloading at lower prices.
3D: Signs of a possible reversal: Ascending Triangle, Fifth Wave, Diagonal Moving Stock (Distortion?)
Breakout to the upside would be extremely bullish…
Lower prices could be seen as a great buying opportunity.
targets Bears: 41 38
Targets Bulls: 45 49
Please let me know if you would like me to analyse an Instrument for you.
Thanks for reading

관련 발행물
면책사항
해당 정보와 게시물은 금융, 투자, 트레이딩 또는 기타 유형의 조언이나 권장 사항으로 간주되지 않으며, 트레이딩뷰에서 제공하거나 보증하는 것이 아닙니다. 자세한 내용은 이용 약관을 참조하세요.
면책사항
해당 정보와 게시물은 금융, 투자, 트레이딩 또는 기타 유형의 조언이나 권장 사항으로 간주되지 않으며, 트레이딩뷰에서 제공하거나 보증하는 것이 아닙니다. 자세한 내용은 이용 약관을 참조하세요.