
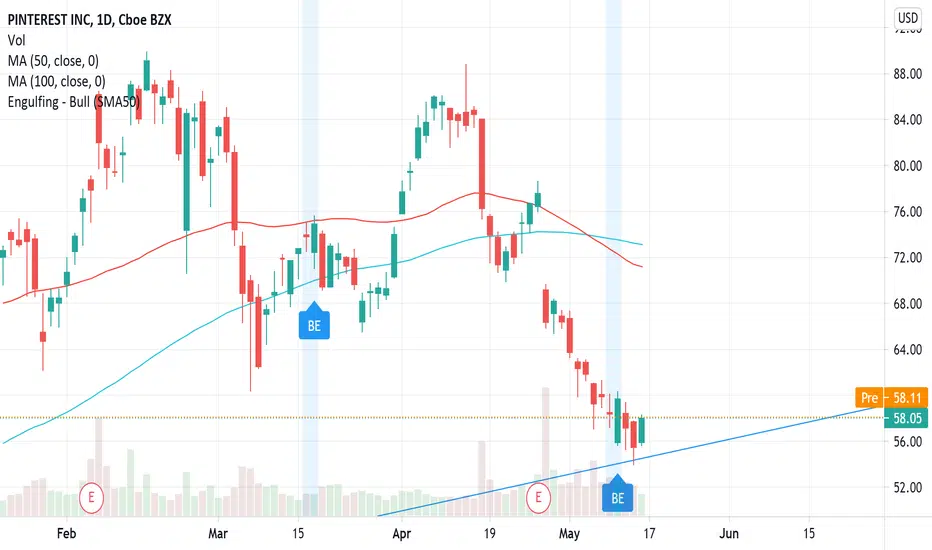
PINS' chart has only seen a Bullish Engulfing (BE) pattern on 4 instances since it has gone public.
1) The first was at the beginning of January 2020 - the stock rallied from $18.88 to $27.10 by Feb 7th, 2020. (43.5% increase)
2) The second was at the end of March 2020 - the stock rallied from $14.92 to $21.59 by May 5th, 2020. (44.7% increase)
3) The third was on March 17th, 2021 - the stock rallied from $74.07 to $88.75 by April 14th, 2021. (19.8% increase)
4) The 4th one just happened on May 11th, 2021.
I think this is a great opportunity to buy PINS as it has shown quick returns (around a month's timeframe) in the past after a BE pattern has been demonstrated. RSI values are also sitting very low (which means the stock is oversold). The Stochastic RSI is also indicating oversold levels. All of these indicators tell us that this is a great time to buy PINS. Please ensure that you set your target sell prices and make sure to do your own due diligence first.
1) The first was at the beginning of January 2020 - the stock rallied from $18.88 to $27.10 by Feb 7th, 2020. (43.5% increase)
2) The second was at the end of March 2020 - the stock rallied from $14.92 to $21.59 by May 5th, 2020. (44.7% increase)
3) The third was on March 17th, 2021 - the stock rallied from $74.07 to $88.75 by April 14th, 2021. (19.8% increase)
4) The 4th one just happened on May 11th, 2021.
I think this is a great opportunity to buy PINS as it has shown quick returns (around a month's timeframe) in the past after a BE pattern has been demonstrated. RSI values are also sitting very low (which means the stock is oversold). The Stochastic RSI is also indicating oversold levels. All of these indicators tell us that this is a great time to buy PINS. Please ensure that you set your target sell prices and make sure to do your own due diligence first.

면책사항
해당 정보와 게시물은 금융, 투자, 트레이딩 또는 기타 유형의 조언이나 권장 사항으로 간주되지 않으며, 트레이딩뷰에서 제공하거나 보증하는 것이 아닙니다. 자세한 내용은 이용 약관을 참조하세요.
면책사항
해당 정보와 게시물은 금융, 투자, 트레이딩 또는 기타 유형의 조언이나 권장 사항으로 간주되지 않으며, 트레이딩뷰에서 제공하거나 보증하는 것이 아닙니다. 자세한 내용은 이용 약관을 참조하세요.