
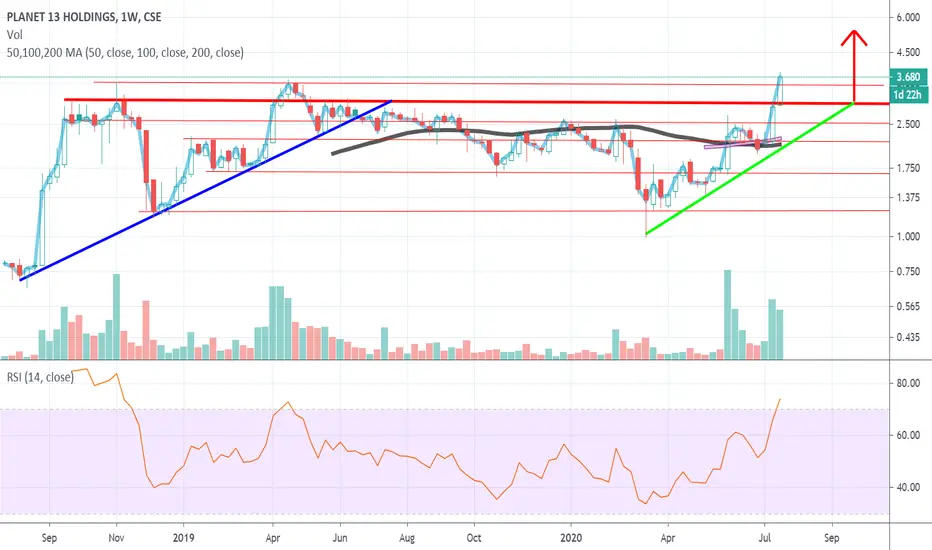
Planet 13 Holdings is displaying a strong breakout of a Ascending Triangle.
Notice the difference in higher high creation on the RSI of this Ascending Triangle compared to the previous one in 2018 & early 2020 that played out bearishly.
I have colored the upward sloping support Blue on the previous ascending triangle, as opposed to Green on the current ascending triangle pattern breakout.
This chart is done on a log scale.

면책사항
해당 정보와 게시물은 금융, 투자, 트레이딩 또는 기타 유형의 조언이나 권장 사항으로 간주되지 않으며, 트레이딩뷰에서 제공하거나 보증하는 것이 아닙니다. 자세한 내용은 이용 약관을 참조하세요.
면책사항
해당 정보와 게시물은 금융, 투자, 트레이딩 또는 기타 유형의 조언이나 권장 사항으로 간주되지 않으며, 트레이딩뷰에서 제공하거나 보증하는 것이 아닙니다. 자세한 내용은 이용 약관을 참조하세요.