
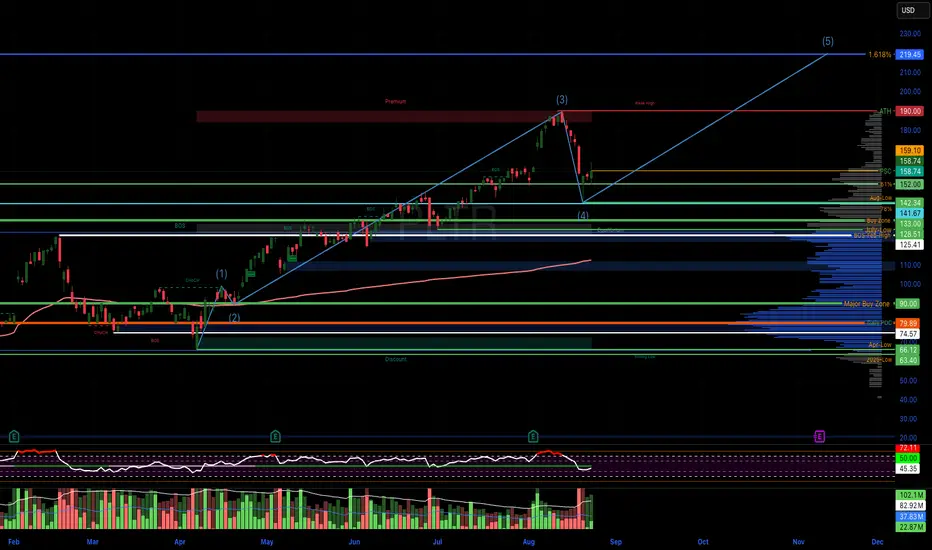
PLTR looks like it is in Wave 4 consolidation/correction. If this holds, the next push higher would be Wave 5, with a likely target retest of $200 - $220. Palantir's next earnings report should be around November 10th, this would line up nicely with a continued run up into earnings, end of year "Santa Rally", hopefully hitting the 1.618% Fib extension at $219.45.
Elliott Wave Count (2025 View)
Wave 1 – The initial strong rally that started early in the year (around the $40–$60 zone) and pushed higher into the $100+ area.
Wave 2 – The corrective pullback that consolidated sideways/downward after the first rally (likely stalling between $80–$100).
Wave 3 – The largest and most impulsive rally that carried PLTR up toward the recent all-time highs (~$180–$190). This leg is clearly extended.
Wave 4 – The sharp pullback off those highs, retracing back to around $150s. This correction looks steep but fits as a Wave 4 since RSI cooled sharply too.
Wave 5 (potentially forming or still ahead) – If this structure holds, the next leg would be another rally attempt, targeting a move back toward or above the prior highs (~$180–$200 zone).
Supporting Clues
RSI: Overbought (>70) at the Wave 3 peak, then cooling into mid-40s (Wave 4 typical reset zone).
Volume: Big spikes on the Wave 3 rally and during the Wave 4 selloff, suggesting strong participation.
200-day EMA: Still rising far below price (~$110s), so long-term uptrend remains intact.
Elliott Wave Count (2025 View)
Wave 1 – The initial strong rally that started early in the year (around the $40–$60 zone) and pushed higher into the $100+ area.
Wave 2 – The corrective pullback that consolidated sideways/downward after the first rally (likely stalling between $80–$100).
Wave 3 – The largest and most impulsive rally that carried PLTR up toward the recent all-time highs (~$180–$190). This leg is clearly extended.
Wave 4 – The sharp pullback off those highs, retracing back to around $150s. This correction looks steep but fits as a Wave 4 since RSI cooled sharply too.
Wave 5 (potentially forming or still ahead) – If this structure holds, the next leg would be another rally attempt, targeting a move back toward or above the prior highs (~$180–$200 zone).
Supporting Clues
RSI: Overbought (>70) at the Wave 3 peak, then cooling into mid-40s (Wave 4 typical reset zone).
Volume: Big spikes on the Wave 3 rally and during the Wave 4 selloff, suggesting strong participation.
200-day EMA: Still rising far below price (~$110s), so long-term uptrend remains intact.

면책사항
해당 정보와 게시물은 금융, 투자, 트레이딩 또는 기타 유형의 조언이나 권장 사항으로 간주되지 않으며, 트레이딩뷰에서 제공하거나 보증하는 것이 아닙니다. 자세한 내용은 이용 약관을 참조하세요.
면책사항
해당 정보와 게시물은 금융, 투자, 트레이딩 또는 기타 유형의 조언이나 권장 사항으로 간주되지 않으며, 트레이딩뷰에서 제공하거나 보증하는 것이 아닙니다. 자세한 내용은 이용 약관을 참조하세요.