
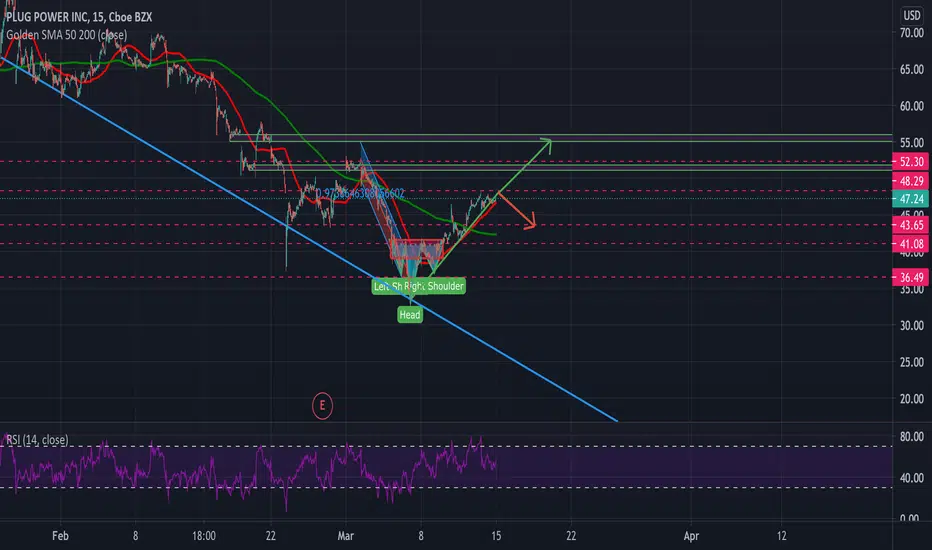
After a long regression, PLUG seems to have found its bottom after falling 40% from its 52-week high ending the regression with an inverse head and shoulders. Bollinger Bands are squeezing on its 6-month chart along with what looks like an impending MACD cross. PLUG needs to break the FIB resistance levels charted which seems relatively likely as long as the broader market doesn't experience a pullback as 10-year treasury yields have been fluctuating. PT1- $51.81, PT2- $56.19
Has strong top resistance at the $69-70 level
Has strong top resistance at the $69-70 level

면책사항
해당 정보와 게시물은 금융, 투자, 트레이딩 또는 기타 유형의 조언이나 권장 사항으로 간주되지 않으며, 트레이딩뷰에서 제공하거나 보증하는 것이 아닙니다. 자세한 내용은 이용 약관을 참조하세요.
면책사항
해당 정보와 게시물은 금융, 투자, 트레이딩 또는 기타 유형의 조언이나 권장 사항으로 간주되지 않으며, 트레이딩뷰에서 제공하거나 보증하는 것이 아닙니다. 자세한 내용은 이용 약관을 참조하세요.