 POLYCAB
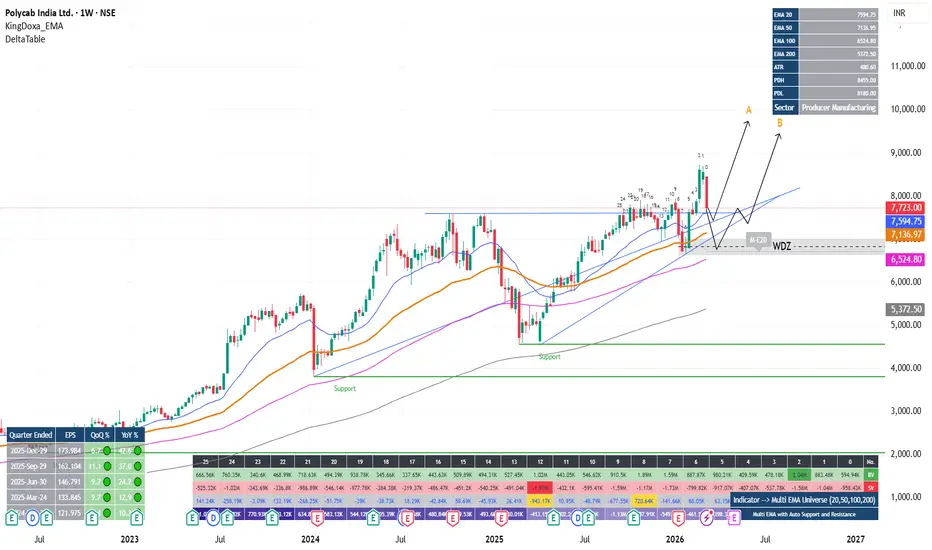
 - Weekly chart represent the strength of the stock.
- On Weekly, stock above all major EMA validating its strength.
- Nice Weekly demand zone is available around 7K which showed its strength of breakout.
- Price currently returned to re-test breakout area.
- On Daily, Price below EMA20 and near to EMA50 represent the pullback not a seller dominance.
- Two major trendline support is also available to hold or return the price.
- Two probable setups available as shown in chart.
NB: Not a Registered Advisor. Many time I failed with my setups. Do take advise from your financial advisor prior trade. Here I am just sharing my views to community, not advising to anybody for buy or sell.
액티브 트레이드
Price exactly follows our assumptions, reach to marked weekly area as per "B" and shown clear reaction on daily chart. Made it more hopeful now.
노트
Plan B is working good, Holding it tight.노트
How many catch that opportunity ?노트
Shifted SL to safe guard the profit. Risk free + surety of closing only in profit.거래청산: 타겟 닿음
Closed with 1: 5 Risk Reward ... Target achieved.

면책사항
해당 정보와 게시물은 금융, 투자, 트레이딩 또는 기타 유형의 조언이나 권장 사항으로 간주되지 않으며, 트레이딩뷰에서 제공하거나 보증하는 것이 아닙니다. 자세한 내용은 이용 약관을 참조하세요.
면책사항
해당 정보와 게시물은 금융, 투자, 트레이딩 또는 기타 유형의 조언이나 권장 사항으로 간주되지 않으며, 트레이딩뷰에서 제공하거나 보증하는 것이 아닙니다. 자세한 내용은 이용 약관을 참조하세요.