
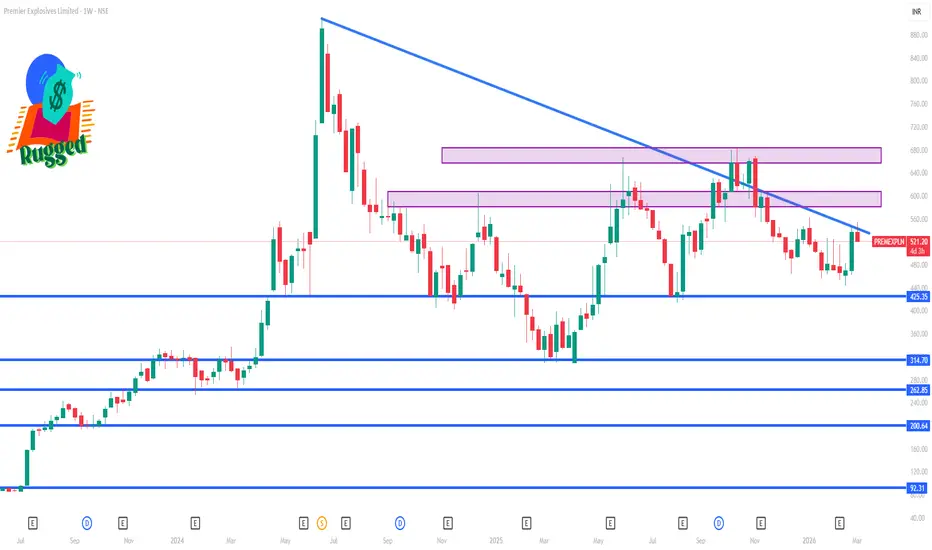
📌 Current price context (late Feb-early Mar 2026):
• Stock has been trading roughly ₹520–₹554 range recently.
📊 Key 1-Week Trading Levels
✔ Immediate Support Levels (Short-Term)
These are areas where buyers may step in if price drops this week:
• ₹500–₹505 area – central pivot zone (pivot ~509)
• ₹490–₹495 – short-term support zone just below pivot/resistance flips
• ₹471–₹475 – accumulated volume support levels & lower range support
• ₹462–₹468 – deeper support if bias weakens this week
Key short-term stop-loss reference (if selling intensifies): ~₹462–₹455 area.
📈 Resistance Levels to Watch This Week
These are zones that may cap upside:
• ₹512–₹518 – pivot-turned resistance zone (important short-term hurdle)
• ₹524–₹532 – next resistance zone if momentum picks up
• ₹540–₹550+ – recent high cluster range — strong resistance above current price
Strong upside break level: A sustained close above ₹550–₹555 may open further momentum.
📌 Short-Term Bias Notes
📉 Technical indicators (TradingView) show mixed to neutral signals in the short term, with overall rating tilting sell on 1-week timeframe — indicating caution if the price fails to reclaim above immediate resistance.
📊 Based on pivot and volume support analysis, downside risk increases only if the stock closes below the ₹470–₹468 zone this week.
• Stock has been trading roughly ₹520–₹554 range recently.
📊 Key 1-Week Trading Levels
✔ Immediate Support Levels (Short-Term)
These are areas where buyers may step in if price drops this week:
• ₹500–₹505 area – central pivot zone (pivot ~509)
• ₹490–₹495 – short-term support zone just below pivot/resistance flips
• ₹471–₹475 – accumulated volume support levels & lower range support
• ₹462–₹468 – deeper support if bias weakens this week
Key short-term stop-loss reference (if selling intensifies): ~₹462–₹455 area.
📈 Resistance Levels to Watch This Week
These are zones that may cap upside:
• ₹512–₹518 – pivot-turned resistance zone (important short-term hurdle)
• ₹524–₹532 – next resistance zone if momentum picks up
• ₹540–₹550+ – recent high cluster range — strong resistance above current price
Strong upside break level: A sustained close above ₹550–₹555 may open further momentum.
📌 Short-Term Bias Notes
📉 Technical indicators (TradingView) show mixed to neutral signals in the short term, with overall rating tilting sell on 1-week timeframe — indicating caution if the price fails to reclaim above immediate resistance.
📊 Based on pivot and volume support analysis, downside risk increases only if the stock closes below the ₹470–₹468 zone this week.

Contact Knowledgehub for a detailed consultation: Dm on WhatsApp: [wa.link/a2o0kz]-
Phone No: [+91 93102 26243]-
Email: [tradingviewknowledgehub@gmail.com]---
-- Let’s achieve success together!
Phone No: [+91 93102 26243]-
Email: [tradingviewknowledgehub@gmail.com]---
-- Let’s achieve success together!
관련 발행물
면책사항
해당 정보와 게시물은 금융, 투자, 트레이딩 또는 기타 유형의 조언이나 권장 사항으로 간주되지 않으며, 트레이딩뷰에서 제공하거나 보증하는 것이 아닙니다. 자세한 내용은 이용 약관을 참조하세요.
Contact Knowledgehub for a detailed consultation: Dm on WhatsApp: [wa.link/a2o0kz]-
Phone No: [+91 93102 26243]-
Email: [tradingviewknowledgehub@gmail.com]---
-- Let’s achieve success together!
Phone No: [+91 93102 26243]-
Email: [tradingviewknowledgehub@gmail.com]---
-- Let’s achieve success together!
관련 발행물
면책사항
해당 정보와 게시물은 금융, 투자, 트레이딩 또는 기타 유형의 조언이나 권장 사항으로 간주되지 않으며, 트레이딩뷰에서 제공하거나 보증하는 것이 아닙니다. 자세한 내용은 이용 약관을 참조하세요.