
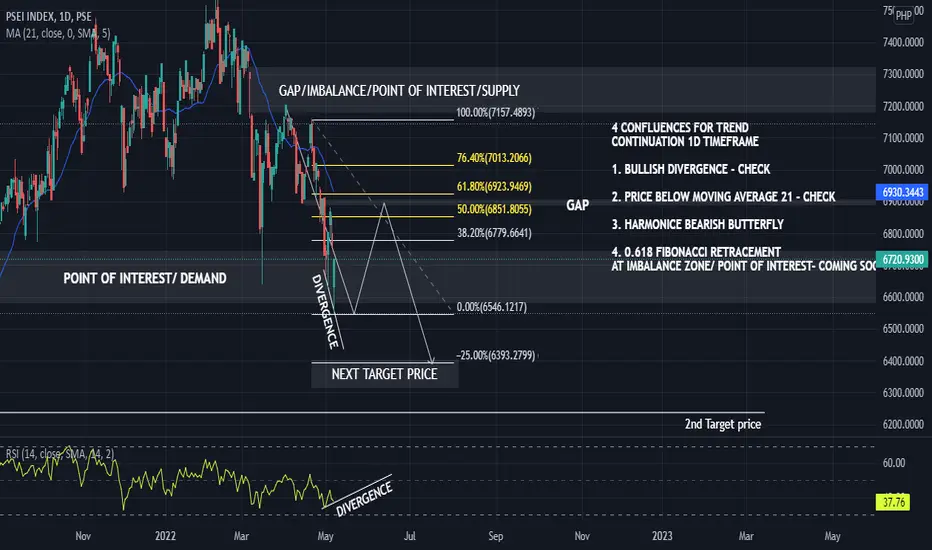
As you can see stocks declined since February due to Global conflicts and etc.
Fundamental Analysis Aside
Technical Analysis since feb indicates that PSEI has bearish signs then on march it showed a choch and a good retracement at an imbalance zone.
another confluence is the harmonic pattern formed at the daily time frame which is a butterfly harmonic, target price 1 already hit at point B of the harmonic pattern.
today it bounced at the demand zone voiding the break of structure as its body closed above the zone
if there is a reversal on 0.618 retracement and imbalance zone expect it will break the structure forming lower lows and higher highs next target is at -0.25 retracement price
the trend will continue for months
Fundamental Analysis Aside
Technical Analysis since feb indicates that PSEI has bearish signs then on march it showed a choch and a good retracement at an imbalance zone.
another confluence is the harmonic pattern formed at the daily time frame which is a butterfly harmonic, target price 1 already hit at point B of the harmonic pattern.
today it bounced at the demand zone voiding the break of structure as its body closed above the zone
if there is a reversal on 0.618 retracement and imbalance zone expect it will break the structure forming lower lows and higher highs next target is at -0.25 retracement price
the trend will continue for months

면책사항
해당 정보와 게시물은 금융, 투자, 트레이딩 또는 기타 유형의 조언이나 권장 사항으로 간주되지 않으며, 트레이딩뷰에서 제공하거나 보증하는 것이 아닙니다. 자세한 내용은 이용 약관을 참조하세요.
면책사항
해당 정보와 게시물은 금융, 투자, 트레이딩 또는 기타 유형의 조언이나 권장 사항으로 간주되지 않으며, 트레이딩뷰에서 제공하거나 보증하는 것이 아닙니다. 자세한 내용은 이용 약관을 참조하세요.