
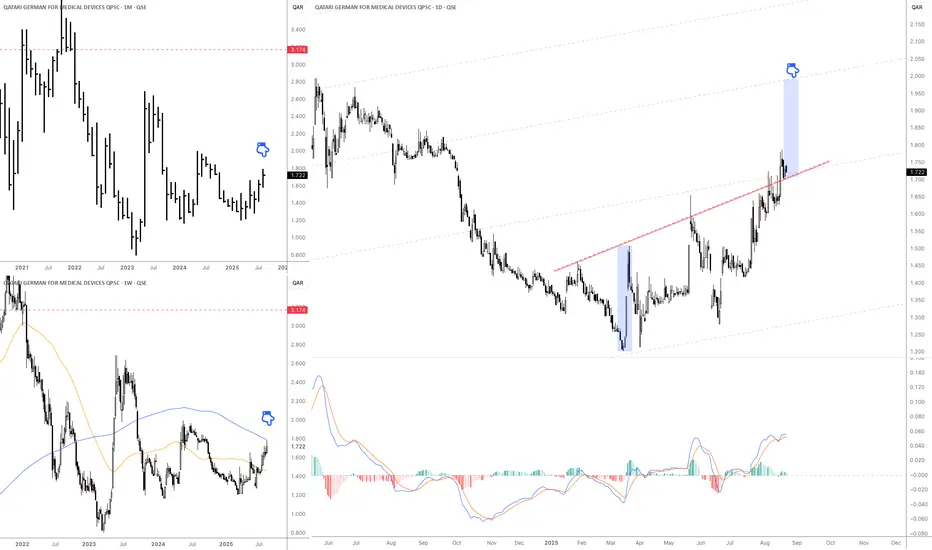
1. Monthly Chart (top-left)
Current price is around QAR 1.72 – 1.80.
Long-term trend has been bearish, but the stock seems to be forming a base and gradually moving higher.
Major long-term resistance sits at QAR 3.17.
2. Weekly Chart (bottom-left)
The 200-week moving average (blue) is close to the current price → a strong resistance test.
A confirmed breakout above the 200-week MA would strengthen the bullish case.
The 50-week moving average (orange) is turning upward, signaling improving momentum.
3. Daily Chart (right side)
The stock broke above a downtrend line (red) and is now holding above it, showing a bullish breakout.
The projected short-term target is around QAR 2.00 – 2.05, based on the rising channel.
MACD indicator is positive, supporting continued bullish momentum.
Key Levels
Nearest Support: QAR 1.60 – 1.65
Short-term Resistance: QAR 2.00 – 2.05
Long-term Resistance: QAR 3.17
Current price is around QAR 1.72 – 1.80.
Long-term trend has been bearish, but the stock seems to be forming a base and gradually moving higher.
Major long-term resistance sits at QAR 3.17.
2. Weekly Chart (bottom-left)
The 200-week moving average (blue) is close to the current price → a strong resistance test.
A confirmed breakout above the 200-week MA would strengthen the bullish case.
The 50-week moving average (orange) is turning upward, signaling improving momentum.
3. Daily Chart (right side)
The stock broke above a downtrend line (red) and is now holding above it, showing a bullish breakout.
The projected short-term target is around QAR 2.00 – 2.05, based on the rising channel.
MACD indicator is positive, supporting continued bullish momentum.
Key Levels
Nearest Support: QAR 1.60 – 1.65
Short-term Resistance: QAR 2.00 – 2.05
Long-term Resistance: QAR 3.17

면책사항
해당 정보와 게시물은 금융, 투자, 트레이딩 또는 기타 유형의 조언이나 권장 사항으로 간주되지 않으며, 트레이딩뷰에서 제공하거나 보증하는 것이 아닙니다. 자세한 내용은 이용 약관을 참조하세요.
면책사항
해당 정보와 게시물은 금융, 투자, 트레이딩 또는 기타 유형의 조언이나 권장 사항으로 간주되지 않으며, 트레이딩뷰에서 제공하거나 보증하는 것이 아닙니다. 자세한 내용은 이용 약관을 참조하세요.