
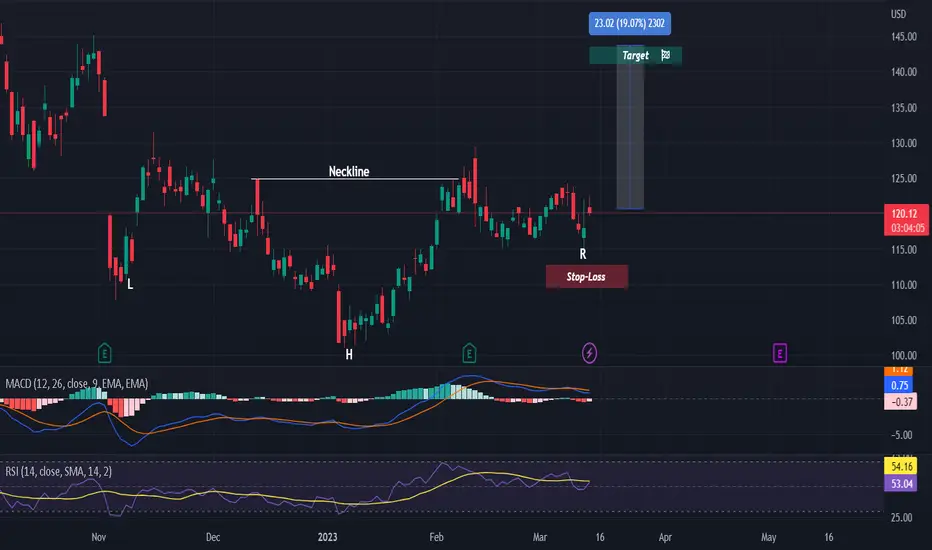
On the chart, we can see an inverse head and shoulders, which is a strong bullish pattern.
Both MACD and RSI are indicating bullish crossings.
We will now wait for a breakout of the neckline, to take our entry.
More details are shown on the chart.
Good luck! 🚀
Both MACD and RSI are indicating bullish crossings.
We will now wait for a breakout of the neckline, to take our entry.
More details are shown on the chart.
Good luck! 🚀

💥 Free signals and ideas ➡ t.me/vfinvestment
관련 발행물
면책사항
해당 정보와 게시물은 금융, 투자, 트레이딩 또는 기타 유형의 조언이나 권장 사항으로 간주되지 않으며, 트레이딩뷰에서 제공하거나 보증하는 것이 아닙니다. 자세한 내용은 이용 약관을 참조하세요.
💥 Free signals and ideas ➡ t.me/vfinvestment
관련 발행물
면책사항
해당 정보와 게시물은 금융, 투자, 트레이딩 또는 기타 유형의 조언이나 권장 사항으로 간주되지 않으며, 트레이딩뷰에서 제공하거나 보증하는 것이 아닙니다. 자세한 내용은 이용 약관을 참조하세요.