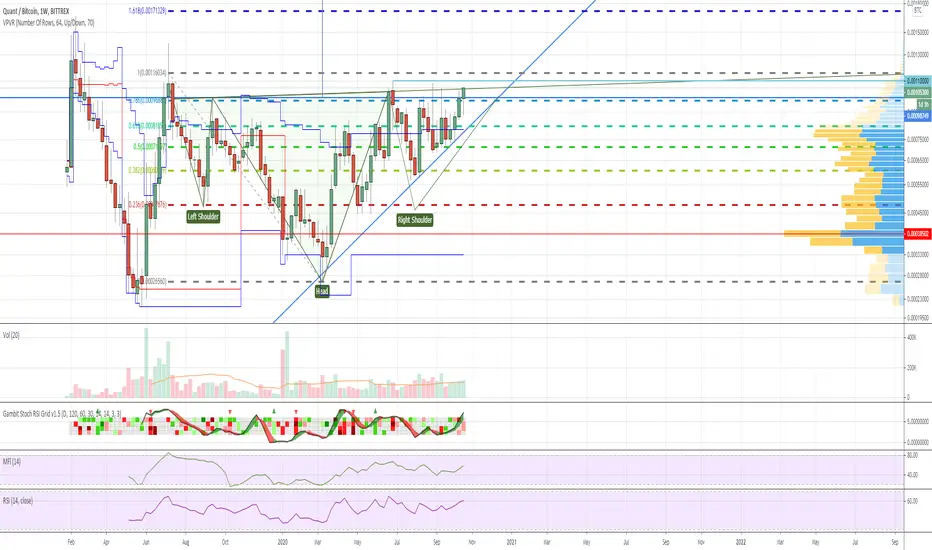
Ascending tirangle + potential head and shoulders pattern.
노트
Looks good on daily although a lot of macro uncertainty노트
Fake break down on lower time frame (triangle) and bounce from ascending triangle support:노트
We are getting some decent volume and spikes at the support area:노트
QNT broke down which I think is a fake move. According to very high volume, I would guess that whales were accumulating QNT.
면책사항
해당 정보와 게시물은 금융, 투자, 트레이딩 또는 기타 유형의 조언이나 권장 사항으로 간주되지 않으며, 트레이딩뷰에서 제공하거나 보증하는 것이 아닙니다. 자세한 내용은 이용 약관을 참조하세요.
면책사항
해당 정보와 게시물은 금융, 투자, 트레이딩 또는 기타 유형의 조언이나 권장 사항으로 간주되지 않으며, 트레이딩뷰에서 제공하거나 보증하는 것이 아닙니다. 자세한 내용은 이용 약관을 참조하세요.