
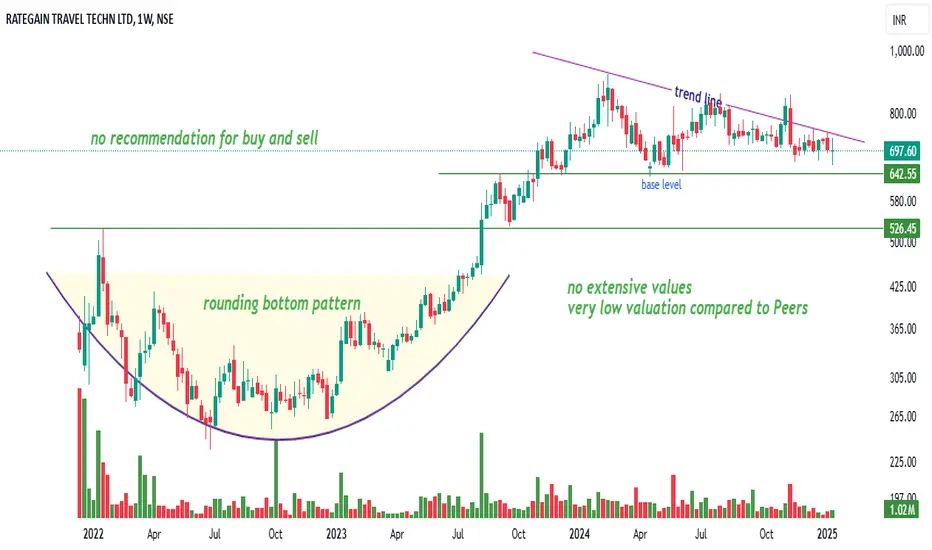
IT stock have lower valuation; im not talk about the PE ratio; im talking on other valuation parameters like LTV/CAC
1. **Rounding Bottom Pattern (📈➡️)**:
The chart shows a rounding bottom pattern, indicating a gradual reversal from a downtrend to an uptrend. This is generally a **bullish** pattern. 📊✨
2. **Trend Line and Consolidation (🔻📉)**:
A downward sloping **trend line** is visible after the peak, indicating some correction or consolidation. This shows **resistance** at higher levels. ⚠️🔎
3. **Support Levels (📉📊)**:
There's a **base level** of support around ₹642 and a lower major support near ₹526. These act as **key levels** to watch for price action. 🛠️📉
4. **Volume Analysis (🔊📊)**:
- **Volume** seems low in certain areas compared to the **rising price**, which might suggest weaker participation. High volume during breakouts will be key. 📉📢
5. **Valuation Comment (📉📊)**:
"Very low valuation compared to peers” could hint at potential opportunities but requires careful analysis. 💹🤔
6. **Neutral Recommendation (🛑)**:
The chart explicitly mentions **no recommendation** for buying or selling. Likely suggesting a **wait-and-watch** approach. 🕰️👀
**Overall sentiment**:
⚖️ Neutral with potential for bullish or bearish moves depending on breakouts or breakdowns around key levels.

면책사항
해당 정보와 게시물은 금융, 투자, 트레이딩 또는 기타 유형의 조언이나 권장 사항으로 간주되지 않으며, 트레이딩뷰에서 제공하거나 보증하는 것이 아닙니다. 자세한 내용은 이용 약관을 참조하세요.
면책사항
해당 정보와 게시물은 금융, 투자, 트레이딩 또는 기타 유형의 조언이나 권장 사항으로 간주되지 않으며, 트레이딩뷰에서 제공하거나 보증하는 것이 아닙니다. 자세한 내용은 이용 약관을 참조하세요.