 RBLBANK
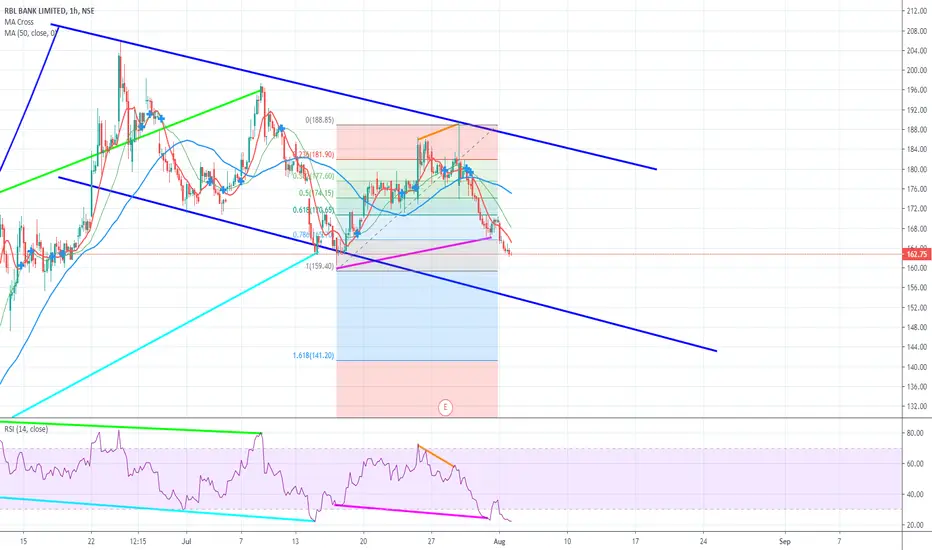
Rbl Bank is forming a Cup since march and completed in July while the Handle is still in formation making a Cup and handle pattern to make a bullish breakout in future.
In 1 hour chart its making same combination of positive and bearish divergence with RSI twice signifying a bullish view in coming period.
In 1 hour chart the price is below 50 days Moving average and the long term MA has crossed above the short term MA implies it will fall more to complete the channel i.e.. the support line of handle.
it has successfully touched the 0.786 level of previsious bulish swing i.e.. 162 and will fall till 0.886 level -inverse Fibonacci retracement.
I can be 100% wrong.
Do your own analysis before trade.
Happy Trading.

면책사항
해당 정보와 게시물은 금융, 투자, 트레이딩 또는 기타 유형의 조언이나 권장 사항으로 간주되지 않으며, 트레이딩뷰에서 제공하거나 보증하는 것이 아닙니다. 자세한 내용은 이용 약관을 참조하세요.
면책사항
해당 정보와 게시물은 금융, 투자, 트레이딩 또는 기타 유형의 조언이나 권장 사항으로 간주되지 않으며, 트레이딩뷰에서 제공하거나 보증하는 것이 아닙니다. 자세한 내용은 이용 약관을 참조하세요.