
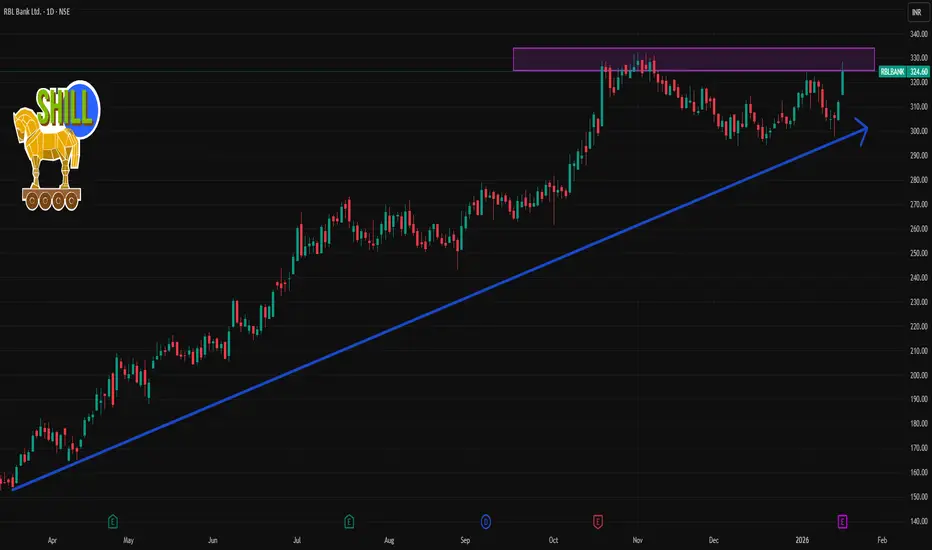
📊 Daily Support & Resistance Levels
Immediate resistances:
~₹315–₹318 area — observed short-term resistance zone and recent highs.
~₹325–₹330 — upper resistance band near recent 52-week highs.
Immediate supports:
~₹300–₹295 — important short-term support zone on daily charts.
~₹285–₹280 — next support cluster if breakdown below ₹295 occurs.
📉 Pivot & Intraday Levels (Indicative)
(These are based on typical pivot calculations from recent sessions — actual values will vary daily)
Pivot: around ₹290–₹295.
R1: ~₹295–₹300
R2: ~₹300–₹305
S1: ~₹285–₹280
S2: ~₹280–₹275
(Pivot-based levels give clues for intraday trading and are often recalculated each day.)
📈 Technical Indicator Context (Daily)
RSI (~50) — neutral momentum, neither overbought nor oversold.
Short MA structure shows mixed signals; some shorter SMAs/EMAs near current price.
MACD slightly bearish to neutral on some sources.
🧠 Notes for Daily Traders
Bullish break above ~₹318–₹320 with volume can open up short-term upside towards ₹325–₹330+.
A daily close below ~₹295 may signal short-term weakness and can expose deeper support around ₹285–₹280.

Contact Knowledgehub for a detailed consultation: Dm on WhatsApp: [wa.link/a2o0kz]-
Phone No: [+91 93102 26243]-
Email: [tradingviewknowledgehub@gmail.com]---
-- Let’s achieve success together!
Phone No: [+91 93102 26243]-
Email: [tradingviewknowledgehub@gmail.com]---
-- Let’s achieve success together!
관련 발행물
면책사항
해당 정보와 게시물은 금융, 투자, 트레이딩 또는 기타 유형의 조언이나 권장 사항으로 간주되지 않으며, 트레이딩뷰에서 제공하거나 보증하는 것이 아닙니다. 자세한 내용은 이용 약관을 참조하세요.