RBS – Poised for bearish break
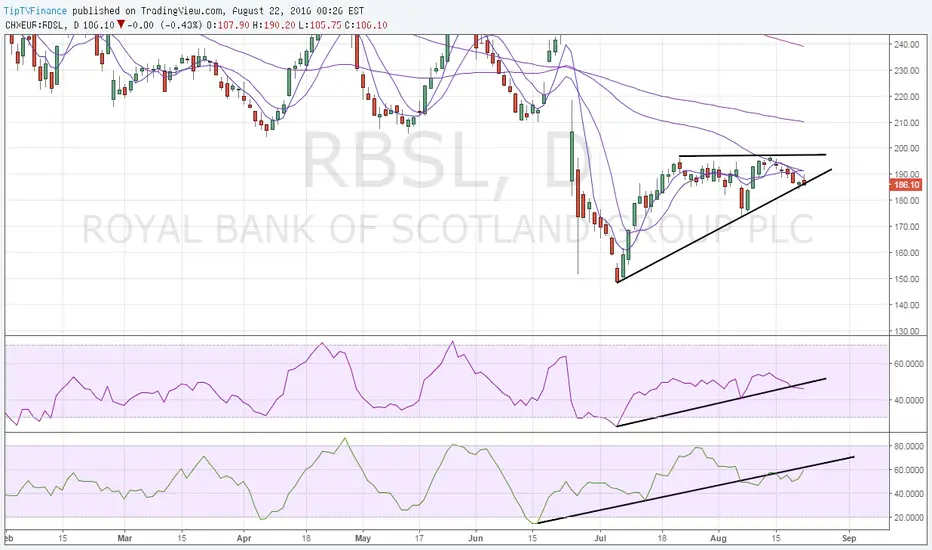
Daily chart pattern – Bearish breakout from rising wedge
Failure to hold above 50-DMA if followed by bearish break from rising wedge on day end closing basis coupled with daily RSI breaching rising trend line and falling money flow index would signal a sell-off to 173.80 (Aug 5 low).
On the higher side, only day end close above 50-DMA would signal bearish invalidation.
Failure to hold above 50-DMA if followed by bearish break from rising wedge on day end closing basis coupled with daily RSI breaching rising trend line and falling money flow index would signal a sell-off to 173.80 (Aug 5 low).
On the higher side, only day end close above 50-DMA would signal bearish invalidation.

관련 발행물
면책사항
해당 정보와 게시물은 금융, 투자, 트레이딩 또는 기타 유형의 조언이나 권장 사항으로 간주되지 않으며, 트레이딩뷰에서 제공하거나 보증하는 것이 아닙니다. 자세한 내용은 이용 약관을 참조하세요.
면책사항
해당 정보와 게시물은 금융, 투자, 트레이딩 또는 기타 유형의 조언이나 권장 사항으로 간주되지 않으며, 트레이딩뷰에서 제공하거나 보증하는 것이 아닙니다. 자세한 내용은 이용 약관을 참조하세요.