교육
Pattern and Structure
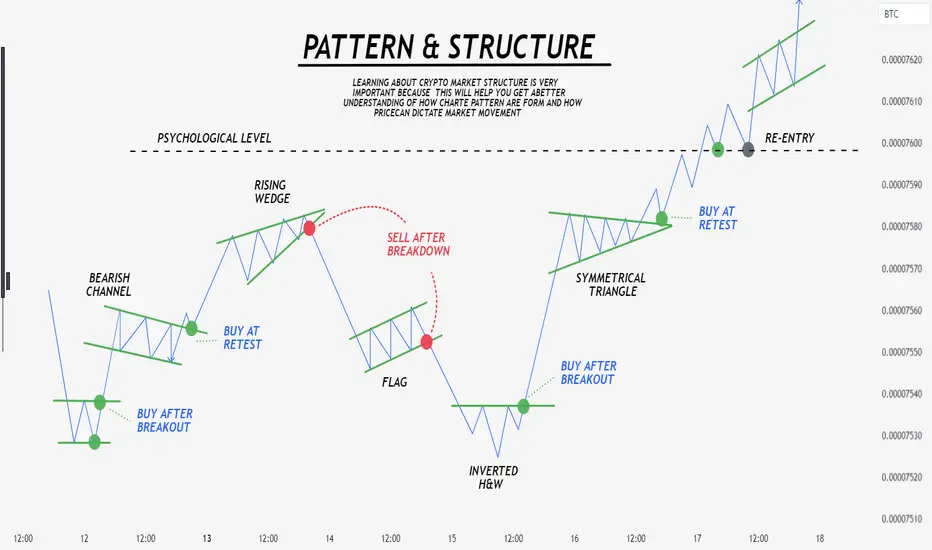
This image provides a visual guide to key chart patterns and market structures in Forex trading. It emphasizes the importance of understanding how these patterns form and how price action influences market movements. The chart showcases several common patterns:
1. Bearish Channel: Traders are advised to buy at the retest after a breakout from the channel.
2. Double Bottom: This reversal pattern suggests buying after the confirmation of the second bottom or the breakout.
3. Rising Wedge: A bearish continuation pattern where selling is recommended after a breakout.
4. Flag Pattern: This continuation pattern typically occurs after a strong price move. The image suggests buying after the breakout.
5. Inverted Head and Shoulders (H&S): A reversal pattern signaling a potential bullish move, with a buying opportunity after the breakout.
6. Symmetrical Triangle: This pattern can break either way, but the focus is on buying at the retest after an upward breakout.
The psychological level plays a significant role, as it represents critical zones where market sentiment often shifts. The chart encourages re-entry after successful retests in bullish patterns. This comprehensive structure helps traders enhance their technical analysis skills and make informed decisions.
1. Bearish Channel: Traders are advised to buy at the retest after a breakout from the channel.
2. Double Bottom: This reversal pattern suggests buying after the confirmation of the second bottom or the breakout.
3. Rising Wedge: A bearish continuation pattern where selling is recommended after a breakout.
4. Flag Pattern: This continuation pattern typically occurs after a strong price move. The image suggests buying after the breakout.
5. Inverted Head and Shoulders (H&S): A reversal pattern signaling a potential bullish move, with a buying opportunity after the breakout.
6. Symmetrical Triangle: This pattern can break either way, but the focus is on buying at the retest after an upward breakout.
The psychological level plays a significant role, as it represents critical zones where market sentiment often shifts. The chart encourages re-entry after successful retests in bullish patterns. This comprehensive structure helps traders enhance their technical analysis skills and make informed decisions.

Daily Free Signals :bit.ly/UnichartzAlpha
Register on Bitunix and trade with me: 👇
bitunix.com/register?vipCode=coEA
Register on Bitunix and trade with me: 👇
bitunix.com/register?vipCode=coEA
면책사항
해당 정보와 게시물은 금융, 투자, 트레이딩 또는 기타 유형의 조언이나 권장 사항으로 간주되지 않으며, 트레이딩뷰에서 제공하거나 보증하는 것이 아닙니다. 자세한 내용은 이용 약관을 참조하세요.
Daily Free Signals :bit.ly/UnichartzAlpha
Register on Bitunix and trade with me: 👇
bitunix.com/register?vipCode=coEA
Register on Bitunix and trade with me: 👇
bitunix.com/register?vipCode=coEA
면책사항
해당 정보와 게시물은 금융, 투자, 트레이딩 또는 기타 유형의 조언이나 권장 사항으로 간주되지 않으며, 트레이딩뷰에서 제공하거나 보증하는 것이 아닙니다. 자세한 내용은 이용 약관을 참조하세요.