
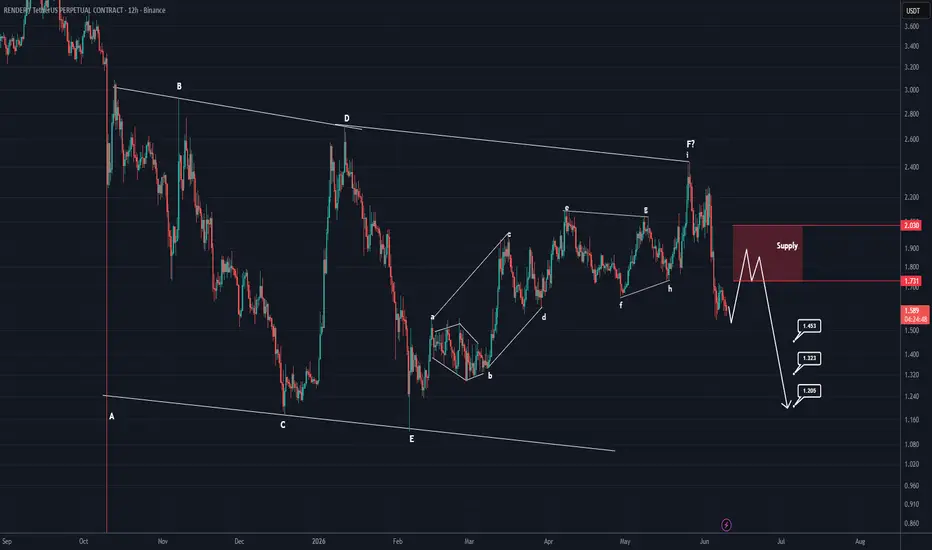
The larger structure that RENDER appears to have formed looks like a Diametric pattern.
Wave F of this Diametric has itself unfolded as a Symmetrical pattern and now seems to be complete. The price is currently developing Wave G of the overall formation.
A pullback into the red zone is expected before RENDER continues its decline.
We are looking for sell/short positions within the highlighted red zone.
The targets are marked on the chart. Once Target 1 is reached, move your stop loss to break-even.
If you have a symbol you want analyzed, first hit the like button and then comment its name so I can review it for you.
Do you also think RENDER is bearish?
액티브 트레이드
It pumped more than 21% according to our previous analysis and reached the entry zone. It can now be rejected.A stronger confirmation for a decline will be issued when CH occurs. We have marked this on the chart.
거래청산: 타겟 닿음
In the end, it dropped by more than 15% , and the first target was hit.
🔥 Don't Just Watch the Market. Understand It!
📊 Crypto Analysis & Setups:
👉 t.me/Behdark_EN
💹 Forex Analysis & Setups:
👉 t.me/FX_Behdark
🚀 Join BehDark for Market Insights, Trading Setups & Key Levels. Choose Your Market & Join Us!
📊 Crypto Analysis & Setups:
👉 t.me/Behdark_EN
💹 Forex Analysis & Setups:
👉 t.me/FX_Behdark
🚀 Join BehDark for Market Insights, Trading Setups & Key Levels. Choose Your Market & Join Us!
면책사항
해당 정보와 게시물은 금융, 투자, 트레이딩 또는 기타 유형의 조언이나 권장 사항으로 간주되지 않으며, 트레이딩뷰에서 제공하거나 보증하는 것이 아닙니다. 자세한 내용은 이용 약관을 참조하세요.