
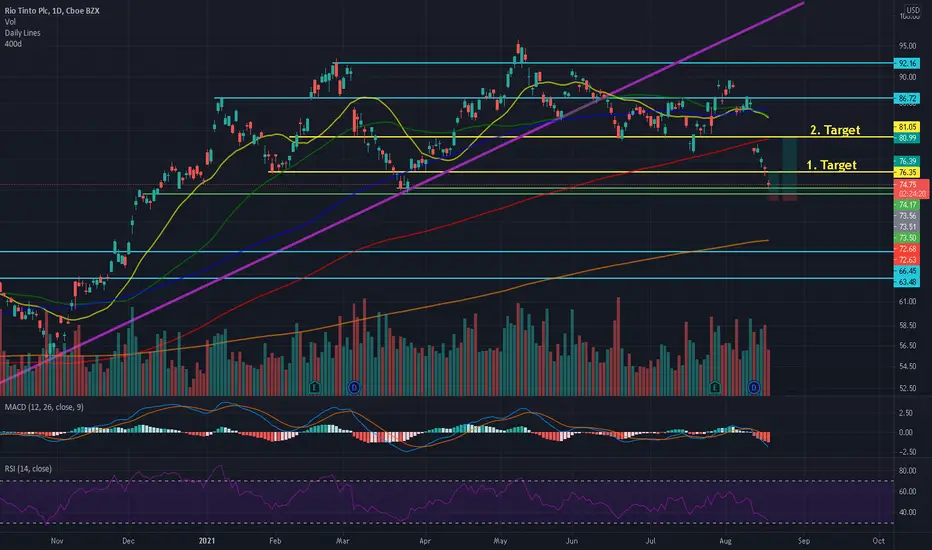
This one will be a complete technical analysis.
Starting point ->>> support lines 73.50$
- 72.64$ Stopploss
- 75.40$ 1. Target
- 81.05$ 2. Target
Buying reasons
-2 support lines 74.17$+73.50$
-daily: RSI oversold (30 area) + MACD tendencies for a countermovement
Selling points
-weekly+monthly MACD indicates sell down
-weekly+ monthly RSI indicates selldown
-under the SMAs (except for 400)
The violet line shows the general uptrend from 2020 to March where we have a break-out (bearish). This shows us that it is unlikely to get ATH. Therefore, I wrote some easier achievable goals.
So, first target has a risk reward ratio of 3.11 with +3.8% upside. Second has risk reward ratio of 8.6 with +10% upside, both with a 1.2% stoploss. The stopploss is based on a Fibonacci retracement.

면책사항
해당 정보와 게시물은 금융, 투자, 트레이딩 또는 기타 유형의 조언이나 권장 사항으로 간주되지 않으며, 트레이딩뷰에서 제공하거나 보증하는 것이 아닙니다. 자세한 내용은 이용 약관을 참조하세요.
면책사항
해당 정보와 게시물은 금융, 투자, 트레이딩 또는 기타 유형의 조언이나 권장 사항으로 간주되지 않으며, 트레이딩뷰에서 제공하거나 보증하는 것이 아닙니다. 자세한 내용은 이용 약관을 참조하세요.