
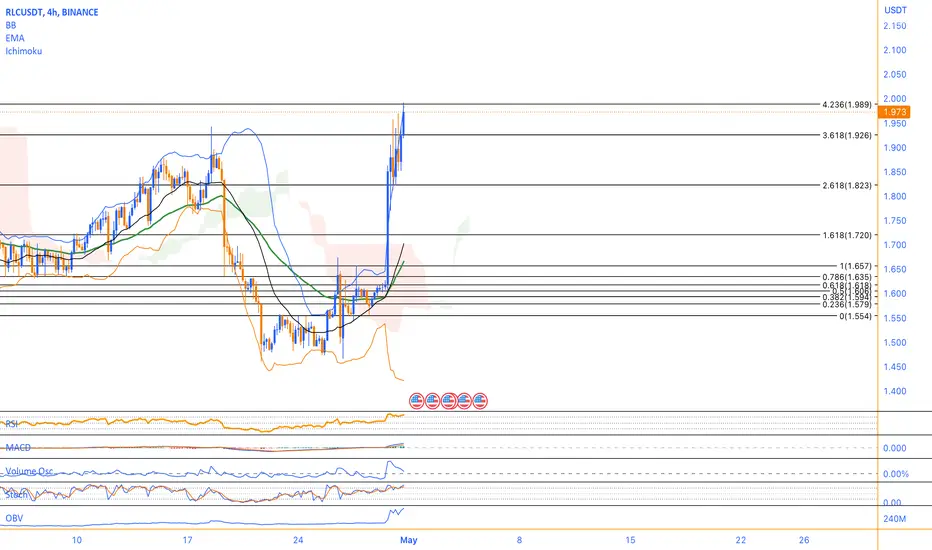
Looking at the chart for RLC, we can see that the current price is at 1.973, with a 4-hour timeframe. The RSI is showing a value of 77, indicating that the coin is overbought at the moment. Looking at the Fibonacci levels, we can see that the 0.5 Fibonacci level is at 1.606, while the 1 Fibonacci level is at 1.657. These levels could act as potential support levels if the price were to fall.
On the other hand, the upper Bollinger band is at 1.982, indicating a possible resistance level if the price continues to rise. The lower Bollinger band is at 1.422, which could serve as a solid support level if the price were to drop significantly. The middle Bollinger band is currently at 1.703, and it may also act as a support level in the future.
Looking at the volume oscillator, we can see that it is currently at 13%, which is not too high but not too low either. The MACD is showing a value of 0.094, which is a positive sign. The stochastic oscillator is quite high at 95, indicating that the coin is in overbought territory.
The hourly EMA 50 is at 1.666, which may act as a support level if the price were to fall. The On-Balance Volume (OBV) is currently at 247.766M, which is a good sign and indicates that the volume is increasing as the price rises.
Based on the chart analysis, we can identify some key support and resistance levels. The 0.5 Fibonacci level at 1.606 could act as a solid support level if the price were to drop. The lower Bollinger band at 1.422 could also serve as a strong support level. On the resistance side, the upper Bollinger band at 1.982 may act as a solid resistance level if the price continues to rise. Additionally, the 1 Fibonacci level at 1.657 could also serve as a potential resistance level.
Overall, the indicators suggest that the coin is currently overbought and may see a correction in the near future. However, the increasing volume and positive MACD are encouraging signs for the long-term trend of the coin.
On the other hand, the upper Bollinger band is at 1.982, indicating a possible resistance level if the price continues to rise. The lower Bollinger band is at 1.422, which could serve as a solid support level if the price were to drop significantly. The middle Bollinger band is currently at 1.703, and it may also act as a support level in the future.
Looking at the volume oscillator, we can see that it is currently at 13%, which is not too high but not too low either. The MACD is showing a value of 0.094, which is a positive sign. The stochastic oscillator is quite high at 95, indicating that the coin is in overbought territory.
The hourly EMA 50 is at 1.666, which may act as a support level if the price were to fall. The On-Balance Volume (OBV) is currently at 247.766M, which is a good sign and indicates that the volume is increasing as the price rises.
Based on the chart analysis, we can identify some key support and resistance levels. The 0.5 Fibonacci level at 1.606 could act as a solid support level if the price were to drop. The lower Bollinger band at 1.422 could also serve as a strong support level. On the resistance side, the upper Bollinger band at 1.982 may act as a solid resistance level if the price continues to rise. Additionally, the 1 Fibonacci level at 1.657 could also serve as a potential resistance level.
Overall, the indicators suggest that the coin is currently overbought and may see a correction in the near future. However, the increasing volume and positive MACD are encouraging signs for the long-term trend of the coin.

Join the free Telegram channel
💎 Telegram Channel: t.me/MonoCoin_Public
🔔 Bot: t.me/MonoCoinSignal_Bot?start=starter_tv
🌐 Website: MonoCoin.net
⭐️ 5-Star TrustPilot: trustpilot.com/review/monocoin.net
💎 Telegram Channel: t.me/MonoCoin_Public
🔔 Bot: t.me/MonoCoinSignal_Bot?start=starter_tv
🌐 Website: MonoCoin.net
⭐️ 5-Star TrustPilot: trustpilot.com/review/monocoin.net
면책사항
해당 정보와 게시물은 금융, 투자, 트레이딩 또는 기타 유형의 조언이나 권장 사항으로 간주되지 않으며, 트레이딩뷰에서 제공하거나 보증하는 것이 아닙니다. 자세한 내용은 이용 약관을 참조하세요.
Join the free Telegram channel
💎 Telegram Channel: t.me/MonoCoin_Public
🔔 Bot: t.me/MonoCoinSignal_Bot?start=starter_tv
🌐 Website: MonoCoin.net
⭐️ 5-Star TrustPilot: trustpilot.com/review/monocoin.net
💎 Telegram Channel: t.me/MonoCoin_Public
🔔 Bot: t.me/MonoCoinSignal_Bot?start=starter_tv
🌐 Website: MonoCoin.net
⭐️ 5-Star TrustPilot: trustpilot.com/review/monocoin.net
면책사항
해당 정보와 게시물은 금융, 투자, 트레이딩 또는 기타 유형의 조언이나 권장 사항으로 간주되지 않으며, 트레이딩뷰에서 제공하거나 보증하는 것이 아닙니다. 자세한 내용은 이용 약관을 참조하세요.