
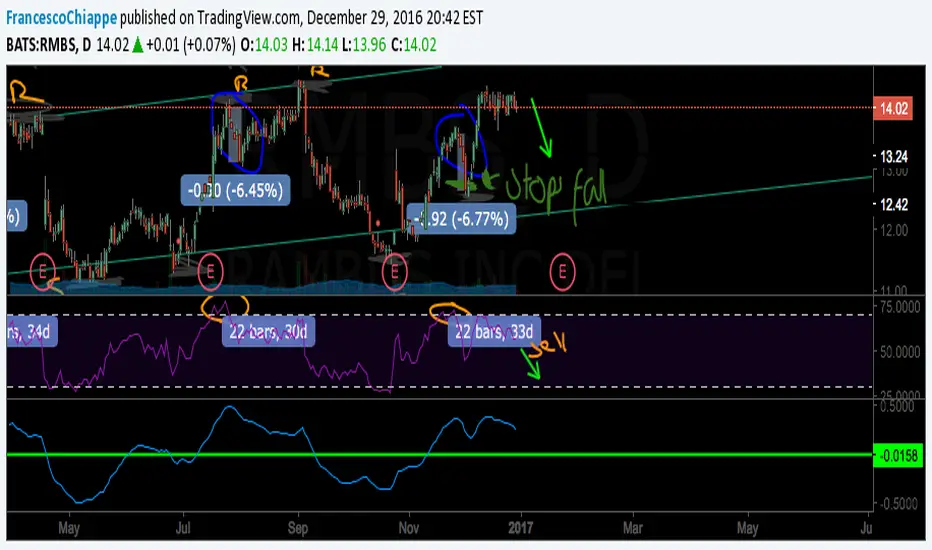
I have been following this stock for a long time and have made great returns with it. The pattern scheme between the chart and the RSI can be used to predict an upcoming downtrend in the price of RMBS. Once the RSI exceeds 75 the chart bounces as the RSI levels out. This leveling out process takes about 20 bars (1 D) and then drops again. The MACD is also showing bearish signs. Any feedback or suggestions would be greatly appreciated!
Also:
Many of the drawings were done prior to movement in the chart. For example, my prediction of the "Stop Fall" in green was done prior to the chart actually stopping at the line.
Also:
Many of the drawings were done prior to movement in the chart. For example, my prediction of the "Stop Fall" in green was done prior to the chart actually stopping at the line.

면책사항
해당 정보와 게시물은 금융, 투자, 트레이딩 또는 기타 유형의 조언이나 권장 사항으로 간주되지 않으며, 트레이딩뷰에서 제공하거나 보증하는 것이 아닙니다. 자세한 내용은 이용 약관을 참조하세요.
면책사항
해당 정보와 게시물은 금융, 투자, 트레이딩 또는 기타 유형의 조언이나 권장 사항으로 간주되지 않으며, 트레이딩뷰에서 제공하거나 보증하는 것이 아닙니다. 자세한 내용은 이용 약관을 참조하세요.