Possible Inverse Head and Shoulders?
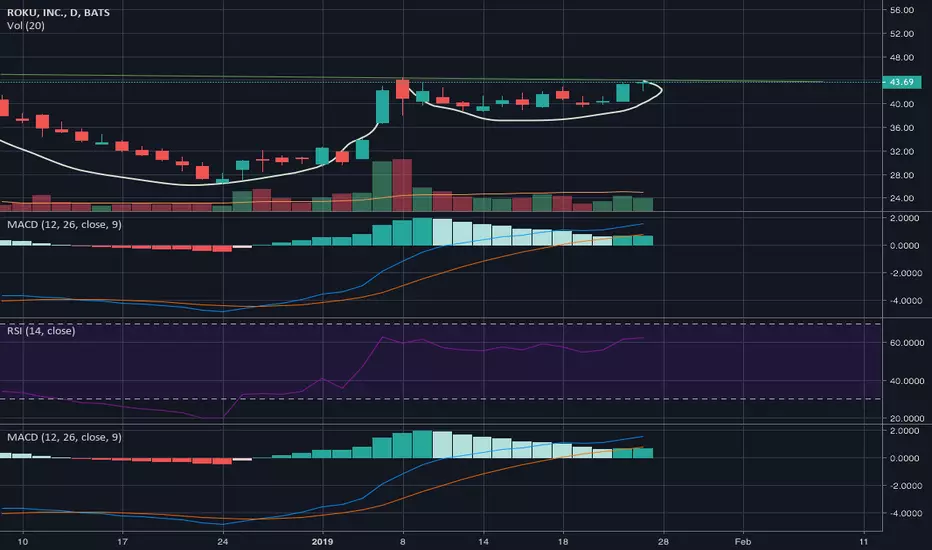
I've never traded Roku, but saw the chart earlier and noticed a possible inverse head and shoulders formation with resistance around the $44.50 mark psychological and depending on where you draw the lines. I'm going to be watching this one closely over the next few days for confirmation... as all you traders know none of this is financial advice.
Let me know what you think, this is my first post so as always trade with your own plan and use as many different indicators or data points as possible.
This is an extremely interesting week with earnings week coming up for most of the big name stocks, along with a possible double top forming if the market does keep with the bearish trend, so as always be on the look out, set your stops where you feel comfortable, protect your capital, and the charts are always helpful but we are trading probabilities and not certainties.
Let me know what you think, this is my first post so as always trade with your own plan and use as many different indicators or data points as possible.
This is an extremely interesting week with earnings week coming up for most of the big name stocks, along with a possible double top forming if the market does keep with the bearish trend, so as always be on the look out, set your stops where you feel comfortable, protect your capital, and the charts are always helpful but we are trading probabilities and not certainties.

면책사항
해당 정보와 게시물은 금융, 투자, 트레이딩 또는 기타 유형의 조언이나 권장 사항으로 간주되지 않으며, 트레이딩뷰에서 제공하거나 보증하는 것이 아닙니다. 자세한 내용은 이용 약관을 참조하세요.
면책사항
해당 정보와 게시물은 금융, 투자, 트레이딩 또는 기타 유형의 조언이나 권장 사항으로 간주되지 않으며, 트레이딩뷰에서 제공하거나 보증하는 것이 아닙니다. 자세한 내용은 이용 약관을 참조하세요.